CHAPTER 16.0 TRANSIT ONBOARD SURVEYSNote: Significant components of this chapter come from Chapter 8 of the FHWA Travel Survey Manual. Material has been reviewed and updated by Guy Rousseau. Previous review done by Arash Mirzaei, Patrick Bonnel and Ken Cervenka.
Transit onboard surveys are conducted to collect data for scheduling and operations planning, long-range planning and design, performance analysis, preparation of statistics and reports, and market evaluations. In many areas, transit ridership is a small percentage of total person trips, and data collected in a household travel survey may not have enough responses to adequately represent the trip patterns of transit users. A well designed transit onboard survey provides detailed information, such as ridership and demographic profiles by route, transfer characteristics and fare-class utilization, as well as accurate sample counts of boardings by station or stop.
Transit onboard surveys obtain travel data by intercepting the respondents onboard a surveyed transit vehicle. The intercept method is considered to be an accurate type of data collection since respondents do not have time to forget the characteristics of their trips. The onboard survey data can be used in models for analyzing new transit alternatives or future transit facilities such as intermodal terminals. The transit onboard data allow corridor level analysis of service options such as increased service, limited-stop (express) routes, and priority bus-lane treatments.
Onboard transit surveys may also include attitudinal components to determine how passengers learn about routes and times, to assess the reasons that individuals ride transit, or to explore amenities (such as lighting at bus stops) which may mitigate rider concerns (such as personal security). Data such as these can help determine marketing potential for new fare policies, services, or amenities.
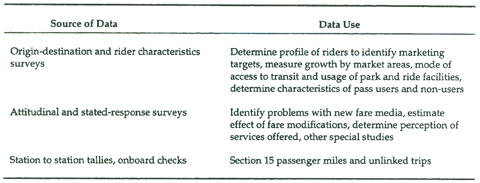
In addition to information on the person trips on the sampled transit routes, total boardings and alightings on each sampled vehicle are directly collected. These data, in conjunction with the total number of vehicle trips on the survey day made on each sampled route by time period and direction, will permit the calculation of average boardings per route per time period by direction. In addition, these data provide the basis for survey sample expansion to represent the entire population of transit users. A few of the data uses and data sources are shown in Table 16.1.
The following discussion focuses on collecting origin-destination and rider characteristics data. Attitudinal questions are sometimes added to the basic data items, but significant care should be applied in designing stated-response, onboard surveys. Stated-response techniques are described in Chapter 13.0. Boarding and alighting counts taken at stations or bus stops, or onboard checks, use a survey design that is fairly uniform among operators and are used on a continuing basis by many transit agencies to obtain the passenger trip length data mandated by the FTA.
Table 16.1 Use of Transit Onboard Survey Data
In many transit onboard surveys, the transit operator will be a sponsor or co-sponsor of the survey and will therefore be part of the survey team. Even when the operator is not a survey sponsor, it is advantageous to include the operator as part of the team. This will greatly assist in obtaining data from the agency, coordinating with drivers, etc.
16.1 Background Data
Collecting data for an onboard survey is a labor-intensive process. The first step is to collect information describing the current transit system and to establish the data items to be collected. The baseline data should contain specific information related to the transit system to be surveyed including:
- An inventory of the number of transit routes in the system, and ideally, GIS layers containing the transit system and bus route coverage overlays on the particular highway network of interest;
- Route maps and schedules (bus block logs or runs sheets) which generally contain information on specific roadway, frequency (headways), route start and end points, time periods, bus stop, transfer, and terminal locations, and fares;
- Route and system travel characteristics such as the number of route round-trips by time period, travel mode (local and express bus, light rail, commuter rail), and daily and peak (period and hour) ridership estimates;
- Variables required for typical mode choice travel model estimation such as the location of park and ride and kiss and ride parking locations, typical parking costs in the vicinity of the transit system, and other transit system access information (related to pedestrian, bicycle, transit, and auto access);
- Census data for the population the transit system is intended to serve (see Appendix B of this manual);
- Previous survey data experiences; and
- Sources which are available for geocoding data (see Chapter 14.0 for a discussion of geocoding).
Several of the data items identified above are used to develop the sample of the transit routes to be surveyed. Issues related to the number of estimated survey returns for each route relate directly to the anticipated boardings for sampled routes. To preserve resources, the low ridership routes may be surveyed as one stratum, rather than separately surveying each route.
The design of the survey must also consider the number and types of transit modes to survey. This analysis relates directly to the requirements of the mode choice model specifications and parameters. For example, the survey design and resources are different for analysis of peak travel compared to daily travel. In addition, depending on the access specifications of the mode choice model and transit network, the analyst may be required to gather additional information (parking costs, access times for walk and auto, etc.) beyond the characteristics of the bus trip itself.
Some of the background data identified above can be obtained by interviewing transit operators over the telephone or in person. Through these interviews, the survey designer should outline the specific data required to develop the baseline condition. Formal written requests for this information are often required. The process for obtaining the background data generally contains the following steps:
- Establish contact with the appropriate staff of the transit operator to be surveyed. The analyst should outline the reasons for the survey and specify the consent of the various client (public) agencies responsible for the study.
- Outline the specific background data needs in a formal letter of request. This request should be sent to the appropriate transit staff. Include a draft memorandum for the operators to post on the garage bulletin boards informing the drivers/dispatchers about the upcoming survey.
- Follow the initial contact and formal data request with the telephone interview or in-person interview. The analyst should schedule this interview with the transit operator after a two-week period at a minimum to ensure that the transit operator has enough time to compile the requested data. On the other hand, if block log information is being requested to pull sample routes and/or runs be sure to allow ample time for pulling the full sample (for scheduling) before fieldwork begins.
- Collect the assembled data, using the most appropriate and convenient method: collect at the in-person interview, or obtain via electronic mail or mail.
The types of available data vary widely depending on transit system characteristics. Some systems have fare structures that monitor each passenger entering and exiting, allowing the potential use of fare collection data to compute maximum passengers loads, number of transfers, trip length, and other operational data. On the majority of systems, fare collection data provide only entrance counts, and in many systems, even with the automated fare collection systems, the counts can be ambiguous. However, there are no transit systems where the fare collection system provides all of the ridership data needed (for example, most systems have pass programs). The gap is typically filled by labor-intensive field surveys that collect information directly from the passengers on board trains and buses or at stops and stations.
It is important that the project sponsor(s) provide ample warning to the transit provider, especially the bus drivers, about the upcoming survey. Drivers should be introduced to the survey supervisors and provided with a general overview of the types of procedures the onboard surveyor will be conducting. Drivers can be asked for recommendations about survey procedures. Since sample bus trips often begin and end at the terminal, the dispatchers and security providers at the bus terminals must be included in the survey process. If the drivers are represented by a union, the union and shop stewards should also be informed of the survey. A letter should be posted on the driver’s bulletin board at each terminal at least two weeks before the survey or the survey pretest are scheduled to begin.
16.2 Onboard Survey Design
16.2.1 Design Issues
The old maxim that there is never enough time to do it right, but always enough time to do it over offers a good warning. However, transit surveys present a more ruinous case: resources rarely allow the option of doing the survey again. A survey done wrong simply results in bad data, which are often worse than no data at all.
Time should be made available to structure and design the survey process properly. Time spent in the planning of the survey will prevent problems that cannot be corrected later. A clear statement of the objectives of the data collection and analysis will provide a frame of reference for assessing each element of the survey method, data items, and analysis effort.
The transit onboard survey can be designed as a stand-alone survey or can complement a household travel survey. The onboard survey is implemented to obtain data for the person trips made on the transit system, and most of the ridership survey design characteristics may be used for either bus or rail systems. The procedures and analysis methods are similar, but since most areas are served primarily by bus transit, the remainder of this chapter refers to survey techniques used on bus systems.
The onboard survey also collects accurate boarding information for the sampled buses. Each boarding passenger is surveyed (either by a self-administered questionnaire or an interview) regarding the characteristics of the trip which is intercepted on the sampled transit vehicle.
The principal steps of survey design include:
- Define the population to be surveyed (e.g., all passengers on the transit system);
- Select a method to collect the desired data;
- Specify the data to be collected;
- Develop a sample plan and determine the appropriate degree of precision and level of confidence;
- Pretest the survey form(s) and procedures;
- Organize the fieldwork; and
- Plan the analysis.
The population to be surveyed may include all passengers on the transit system, peak-period passengers, passengers on specific routes/route branches or express segments on routes carrying a certain percentage of total system ridership (e.g. 90 percent).
16.2.2 Survey Methods
Several types of transit onboard survey methods can be considered, including the following:
- Drivers hand out survey questionnaires to passengers, and passengers hand back or mail back completed questionnaires. This method works for express lines with low boarding/alighting activity and on systems where the bus drivers are fully cooperative with the survey. Generally, the method requires a concentrated driver involvement effort early in the design effort in order to persuade drivers to cooperate fully and willingly. Response rates vary. Accurate boarding counts may not be obtained.
- Surveyors aboard the transit vehicles conduct interviews with boarding passengers, record the passenger responses, and count each boarding passenger. This method is useful where the number of data elements is limited so that the interview time is short. Interviews can be simplified by using a bilingual interviewer, which eliminates the problem of non-response due to poor literacy. The response rate for interviews is generally higher than for self-administered surveys, typically 30 to 40 percent of all boardings. This method is the most resource intensive, but with training, interviewers can achieve very accurate results. For instance, interviewers can probe for better geographic information or clarify trip frequency questions.
- Surveyors aboard the transit vehicle hand out questionnaires to passengers and collect or allow passengers to mail back completed questionnaires. This method of using a self-administered questionnaire handout with the option of a mail-back response has been the state-of-the-practice for many years. One surveyor can distribute questionnaires and conduct accurate boarding counts of passengers. In addition, each questionnaire is serially numbered to act as a check against the counts and to link it to a specific vehicle, direction, and time period when it is mailed back. Typical response rates are 20 to 30 percent of all boardings. The returns may have to be checked for missing data, illegible data, or erroneous data.
The two self-administered survey methods – where the driver hands out the questionnaires or a trained surveyor hands out questionnaires and counts passengers – usually require survey teams to provide the respondent with the ability to mail back the completed survey form. Only in unusual cases would a hand-out form not include a mailback option. Many agencies already have business reply accounts and post office boxes. The survey planner should always check the size of the post office box since even a modest survey can generate a high volume (spatially) of returned forms.
The 1972 Urban Mass Transportation Travel Surveys manual states that the response rate for an onboard survey can be improved by using extensive publicity prior to the survey day (U.S. Department of Transportation, Urban Mass Transportation Administration, 1972). If extensive efforts are not feasible, modest amounts of publicity can still improve the response rate and are worth the additional effort.
The 1972 Urban Mass Transportation Travel Surveys manual (.S. Department of Transportation, Urban Mass Transportation Administration, 1972) also suggested the following methods for dealing with non-response:
- First, it was expected (and later verified) that the rate of questionnaire return would vary for passengers having different socioeconomic characteristics. To help correct for this, separate expansion factors were developed for each bus route.
- Secondly, it was expected that the rate of return for longer person trips might be better than the return for short, inner-city trips. Patrons making longer trips were afforded more time on the bus to complete their questionnaires and did not receive their cards on the inner portion of the route, where congestion mitigated against good survey response. To combat this potential problem and to assist in correcting for socioeconomic differences, each bus route was split into quarters, and a separate expansion factor was prepared for each. The technique for quartering the bus routes was to assign the first 25 percent of all cards handed out on each individual bus trip to the first quarter, the next 25 percent to the next quarter, and so on.
- Since not only trip purpose, but also socioeconomic characteristics of the inbound passengers, might change throughout the day, differing response rates were expected by time-of-day. This third source of bias was again corrected by developing different factors for the a.m. peak, the p.m. peak, and the remainder of the day.
- The net result of the differential factoring required by the preceding three corrections was a set of twelve different subcategories with different factors for each bus route involved. The information on the survey trip report allowed the allocation of both cards handed out and cards coded to the various categories for development of expansion factors.
- A final potential problem anticipated was the fact that a trip involving an origin and destination on opposite sides of the study area would start out inbound on both legs of the round trip. Thus, these passengers might receive two survey cards per round trip, resulting in double counting. This problem was handled by a detailed cell by cell examination of a preliminary trip table to pick out zone interchange movements showing travel in both directions. Survey cards corresponding to the outbound direction were assigned a factor of zero.
The survey method should be carefully chosen based on balancing the required accuracy against the resources available.
16.3 Drafting and Constructing Survey Materials
16.3.1 Data Elements and Survey Forms
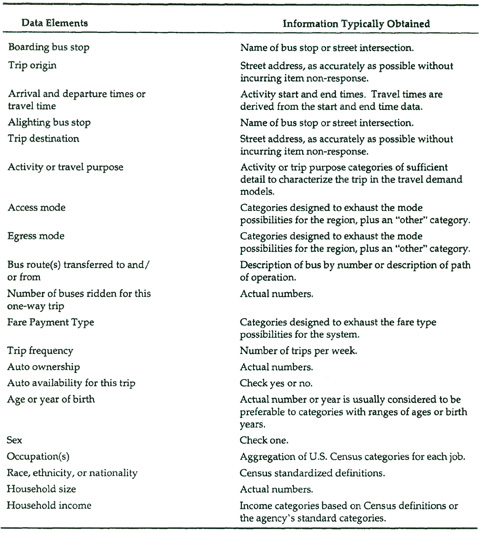
Once the survey method has been chosen, the planner should consider data requirements. There are two levels of origin-destination data that eventually require geographic coding and analysis: bus stop-to-bus stop data, and origin to destination data for the passenger’s door-to-door trip pattern. Origin-destination surveys are typically designed to obtain other information as well, within the limitations of the questionnaire or the time allotted for the interviews. Interviews should take no longer than 10 minutes to complete, and shorter interviews of three to four minutes result in better responses. The data can be collected for passengers in corridors, by route, by direction, and/or time-of-day. The basic data for an origin-destination survey would include the items presented in Table 16.2.
The last three data items are not specifically for analysis of transit usage, although auto availability and ownership are related to captive transit ridership. The primary purpose of these last items is to link the socioeconomic characteristics of the passenger to similar persons in households collected through the household survey or to information available from the census. These data are required for travel demand modeling. Other information can include questions on fare type and cost, transit pass usage, perceived quality of transit service, advertisement penetration, and the passenger’s commuting habits, to name a few.
The wording of questions must be carefully considered and be consistent with other types of travel surveys underway. For example, consistent questions about trip-making are necessary for household travel surveys and vehicle intercept surveys that may be conducted concurrently with the transit onboard survey. This ensures consistent information on travel behavior characteristics of persons within a region that will prove useful in estimating various elements (or model components) of regional travel demand forecasting systems.
In addition, information collected in transit onboard surveys, and, for that matter, all types of travel surveys, should maintain consistency with the current census data specifications. For example, the household, person, and trip information collected in a transit onboard survey should maintain the same categories as specified in the latest census, including breakdowns of income levels, occupation codes, and ethnic status.
The sequence of the questions should follow logically to improve the clarity of the questions. A classic ordering of questions would be the following:
- Where did you get on this bus?
- How did you get to that bus stop?
- Where did you come from? (home, work, school, shopping, etc.)
- What is the location of that place? (geographic location of the origin)
- Where will you get off this bus?
- How will you get from that bus stop to where you are going?
- Where are you going to now? (home, work, school, shopping, etc.)
- What is the location of that place? (geographic location of the destination)
Table 16.2 Common Data Elements for Transit Onboard Surveys
By asking the name of the bus stop where the person got on before asking the origin of the trip, the respondent understands that ‘where are you coming from’ is something different from ‘where did you get on this bus.’ For detailed instructions on collecting and formatting geographic data, the reader should refer to Chapter 14.0.
Figures 16.1 through 16.5 present examples of self-administered onboard surveys.
The first three forms were designed to be passed out on buses from and to which passengers frequently transfer. Therefore, each questionnaire begins by asking whether the respondent has completed a questionnaire yet. This information is needed to properly expand the survey results. After this first question, each of the questionnaires gather origin-destination data, the primary data elements of the surveys. Since item completion tends to drop off as respondents progress through the questionnaire, it is almost always a good idea to put the most important data items first (Zmud, 1996). The questions on the Detroit survey shown in Figure 16.3 are oriented from most important to least important. Note that because of its relative importance, the household income question appears in the middle of the questionnaire, rather than at the end as is usually the case.
The Detroit Bus Survey and the two rail surveys (Figures 16.4 and 16.5) offer respondents a chance to win in an upcoming prize drawing. The drawing acts both as an incentive to participate and a mechanism to obtain information for re-contacting respondents. In the Detroit survey, the telephone information was used to perform clarification follow-up calls. The address information was used to improve the geocoding of the origin and destination data gathered in questions 4 and 8. In the BART survey (Figure 16.4), the telephone numbers were used to develop a contact list for future surveys. The mailing address and telephone numbers gathererd in the LIRR survey (Figure 16.5) were used to perform a telephone-mail-telephone survey of respondents.
In many cases, personal interviews are conducted with boarding passengers. Although this increases the cost of conducting the survey, it ensures sufficient responses and clean and complete data for robust estimates. In a personal interview, the number and wording of questions must be considered carefully since there is no privacy on the bus. For either the interview or self-administered survey, if the origin or destination (boarding bus stop or alighting bus stop may be substituted in some cases) is not complete, the questionnaire is considered a non-response since the data most important to the survey objectives have not been obtained.
Any origin-destination survey method involves the use of a survey form to collect information directly from the passenger, either by a self-administered form or interview form. Other control forms are required to organize and keep a log of field data. A log is used to tabulate boardings and alightings by vehicle trip and to keep track of the questionnaire serial numbers handed out on each trip. In addition, depending on the survey method used, each vehicle trip requires an envelope in which completed questionnaires/interview forms are stored. The surveyor’s work shift is delineated on the surveyor’s assignment sheet, and quality control necessitates the use of an editor’s (or survey administration) log. An example of an administrative form is shown in Figure 16.6.
16.4 Sampling
16.4.1 Survey Population and Sample Selection
Generally, onboard transit surveys employ “two-stage samples.” The first sample is a selection of the transit vehicle trips from all the transit trips in the study area. It is important to distinguish between the “vehicle trips” made by the buses and the “person trips” about which passengers are asked to provide information. A vehicle trip is defined as a one-way directional movement of a bus from the beginning of a route to some other point of the route (usually the mid-point). The second stage is the sample of passengers riding a particular sampled bus trip.
In the classic transit onboard survey, each boarding passenger is given a questionnaire to fill out. It is not expected that every passenger will respond. In fact, the completion rate will vary depending on the route, surveyor, and time-of-day. The return rate should be thoroughly tested in the pilot study to determine what response rate can be expected.
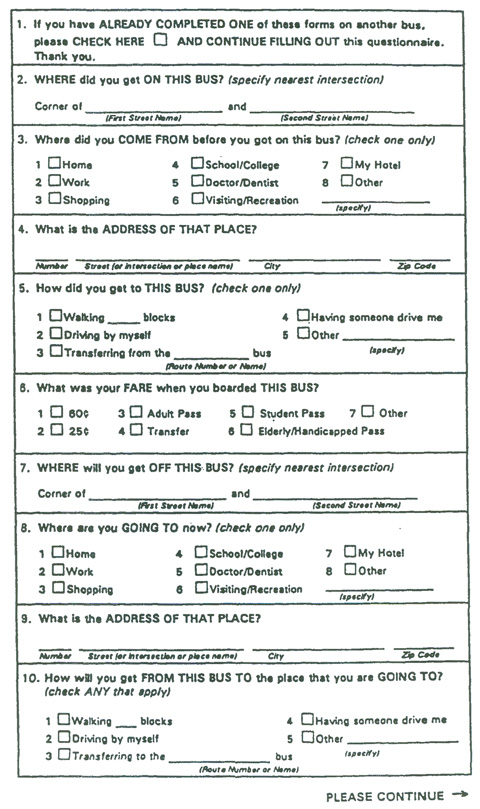
Figure 16.1 An Example Self-Administered Transit Onboard Survey Form
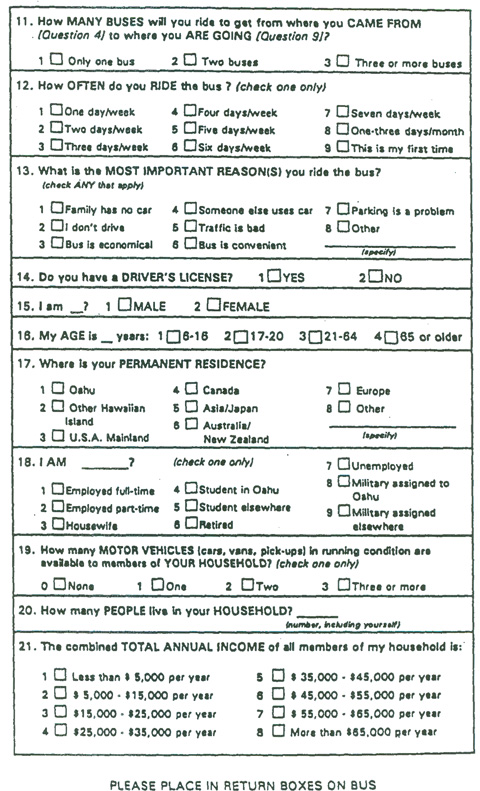
Figure 16.1 An Example Self-Administered Transit Onboard Survey Form (continued)
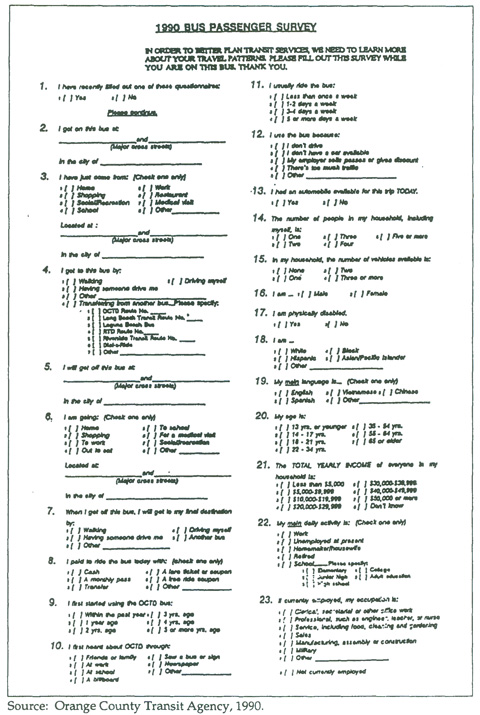
Figure 16.2 OCTA Onboard Bus Survey Form
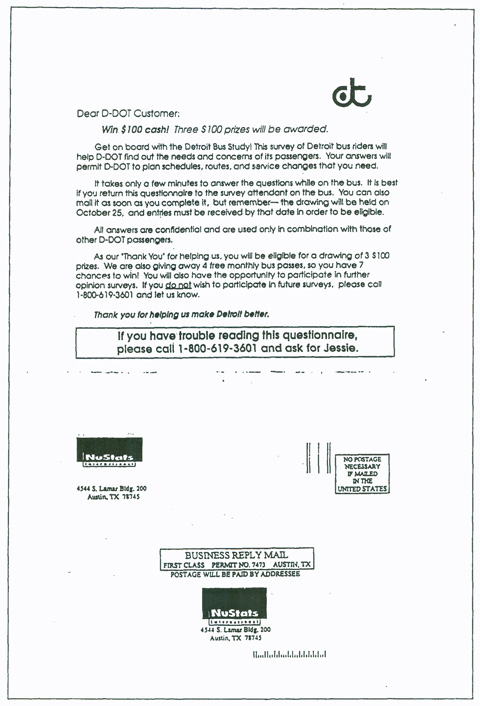
Figure 16.3 Detroit Bus Study Survey Form
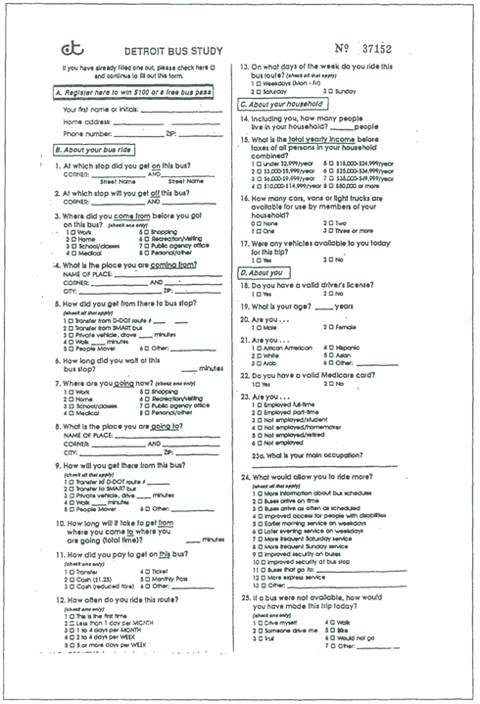
Figure 16.3 Detroit Bus Study Survey Form (continued)
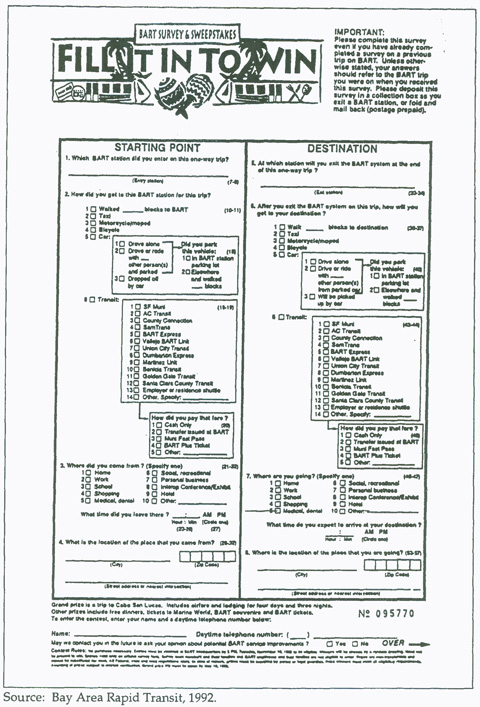
Figure 16.4 BART Onboard Survey Form
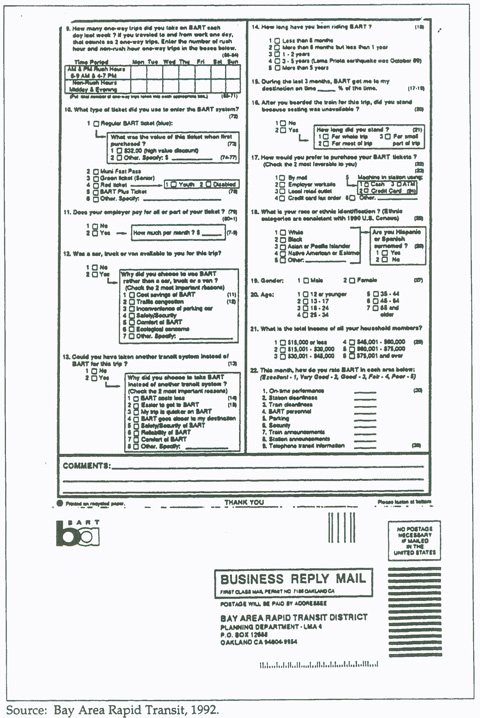
Figure 16.4 BART Onboard Survey Form (continued)
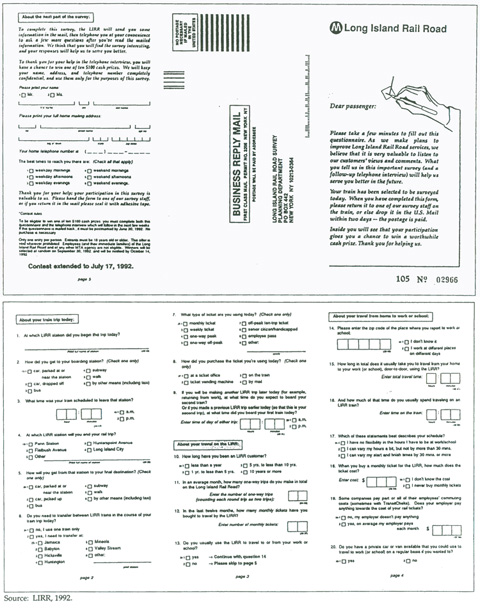
Figure 16.5 Long Island Rail Road Onboard Survey
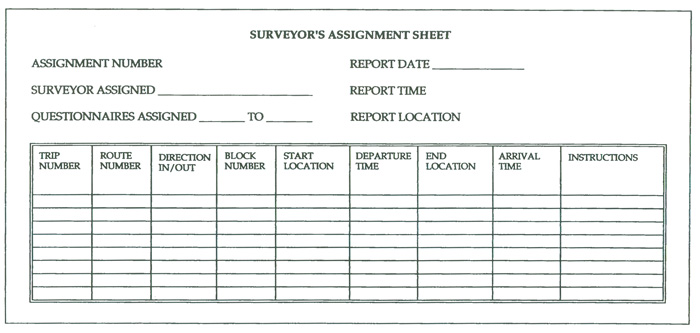
Figure 16.6 Example of an Onboard Survey Administrative Form
The total number of bus trips which must be sampled will be determined by the response rate on each bus trip.
It should be noted that it is inevitable that some persons will be riding more than one of the bus trips surveyed and will therefore be recruited for the survey more than once. In general, it is best to ask such individuals to complete the survey each time they are recruited. However, all passengers should be asked specifically if they have completed surveys on other bus trips and whether these responses were part of the same person trip (because of transfers or on the same route as part of a round trip). This will provide the necessary information to weight these surveys and to identify any double counting, which could affect survey expansion.
While it would be possible to take a simple random sample of bus trips, it is not the ideal method. First, a random sample would not guarantee coverage geographically. Also, some routes might not be sampled at all, if the number of trips on a route is low compared to the population of trips. A random selection of bus trips is also not cost effective. The sample design calls for a surveyor to ride the sampled bus trip and interview or pass out self-administered questionnaires to passengers as they board the bus. If a single bus trip is selected at random, the surveyor rides that trip, then gets off to go to the start point of a second random trip. This results in as much as half the survey time being spent traveling to and from sampled bus trips.
Instead of taking single bus trips as samples, one can take a cluster of bus trips (several bus trips with common characteristics). If the sample cluster is a cluster of bus trips by route, in effect the sample is stratified by route, which ensures representation by route. If the cluster of trips are in sequence by time-of-day, it also ensures that the sample is representative by time-of-day. To the extent that the clustered bus trips alternate between inbound and outbound one-way direction, a clustered sample ensures representation by direction.
The unit of work for a bus for a particular day is called a block. Typically, bus blocks are selected as the basis of clusters of bus trips. A block of trips is assigned to each surveyor. The surveyor stays on the bus throughout that cluster of trips, riding from the morning peak through the evening peak, inbound and outbound, counting boarding passengers and distributing questionnaires or interviewing passengers. To cover a local route, two-person days would typically be required, and in some time periods/corridors, three to four-person days are necessary.
Most transit onboard surveys are conducted during months when school is in session, i.e. spring and fall. Typically, the survey is conducted onboard the sampled transit vehicles on weekdays for a full operating day. Survey times may vary depending on available project resources and needs. The number of sampled person trips is based on average boardings per bus for the route in the time period and the number of required samples per route. Since ridership varies dramatically by time-of-day, bus trips are further stratified into a.m. peak, off-peak, and p.m. peak-time periods. Finally, the ridership is quite different in the a.m. peak in the inbound direction and the outbound direction, so stratification by direction of the trip is necessary. A typical sample requires a minimum of two bus trips per time period and direction for each surveyed route.
16.4.2 Sample Size
Sample size is a function of the sample error (also referred to as the degree of precision) to be tolerated at a specified level of confidence. The sample size refers to the number of usable response by each stratum, i.e., route, time period, etc. In addition, there is a finite population correction (reduction) in expected sampling error as the ratio of sample size to population size increases. The equation defining sample size requirements is presented below:
σp = (pq / n)1/2
where:
σp = standard error of the proportion p
p = proportion of sample elements having a particular attribute, e.g., sex
q = 1 - p
n = number of completed sample interviews of passenger boardings on a route
m = number of passenger boardings for an average weekday on a route
To maximize the sample size (p=50 percent), this equation leads to the number of required samples shown in Table 16.3. These sample sizes are required for each stratum of the survey, for instance each route. If a greater number of strata are to be used, for instance time periods within a route, then the number of samples increases proportionate to the required strata. Table 16.3 shows that a relative error of ± 10 percent at the 95 percent confidence level would provide good precision at the route level and would require about 384 completed interviews, ignoring the finite population correction. The same precision at the 90 percent confidence level could be achieved with 271 completed interviews per route.
The simplified equations in the right-hand column of Table 16.3 include a finite population correction factor; m is the number of boardings in each stratum (i.e., route). When the number of boardings is high the correction is small. For example, if a route has 20,000 daily boardings, an estimate would have a ± 5 percent error at the 90 percent confidence level based on 267 responses. When the number of boardings is low, the correction may be significant. For example, with 750 boardings, the same precision can be achieved with only 199 responses.
Table 16.3 Confidence Levels and Sample Sizes
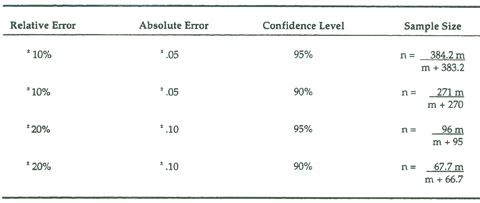
16.4.3 Precision for Each Stratum
To achieve a particular level of confidence for each separate stratum of a bus route the same number of samples are required, leaving off finite correction for the moment. A combination of five time periods and two directions will produce 10 strata. The impact on sample requirements per route is tenfold. For example, using an absolute error of + 0.5 at the 95 percent confidence level requires 384 completed interviews per stratum. If a hand-out survey is used, with an expected response rate of 25 percent, a total of 1,536 questionnaires would have to be distributed in each time period and direction for each route (1,536 * .25 = 384). If equal precision is desired for each of the five time periods and two directions (the ten strata), a total of 15,360 questionnaires per route would be distributed. This is clearly beyond the resources of any agency to accomplish.
Survey factoring, including the calculation of precision for each stratum using finite correction, helps mitigate some of the poor hand-out and return rates. The data expansion procedures are explained later in this section. However, factoring procedures should be clearly understood and detailed before the sampling is complete. Otherwise, the procedures and assumptions established during sampling might prove inadequate to control sample bias and provide adequate statistical precision.
16.4.4 Sample Selection
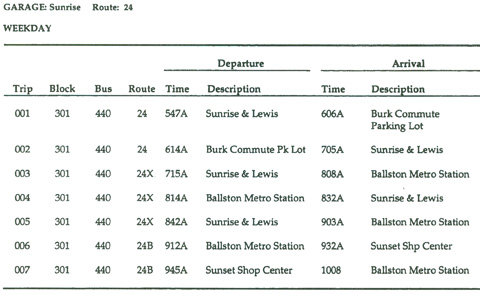
The actual sampling of specific bus routes requires a tabulation of the number of trips each bus on the route makes within the selected time periods. Each bus is numbered, and can be traced through its workday from the first trip to the last. This listing of one-way bus trips for each day is called a block, or sometimes a run, and a full system listing for all buses is called a block log. A simplified example of a bus block is shown in Table 16.4.
As Table 16.4 shows, block 301 begins with bus route 24, branches to bus route 24X for three trips in the morning peak, and then branches to bus route 24B. For sampling purposes, branch routes are included in the main route unless specific conditions related to geographic boundaries and ridership estimates require a separate sample. Therefore, block 301 consists of seven trips – three inbound and two outbound trips during the morning peak (5:00 to 9:00 a.m.) and one outbound trip and one inbound trip in the off-peak period.
Table 16.4 Example Block Log
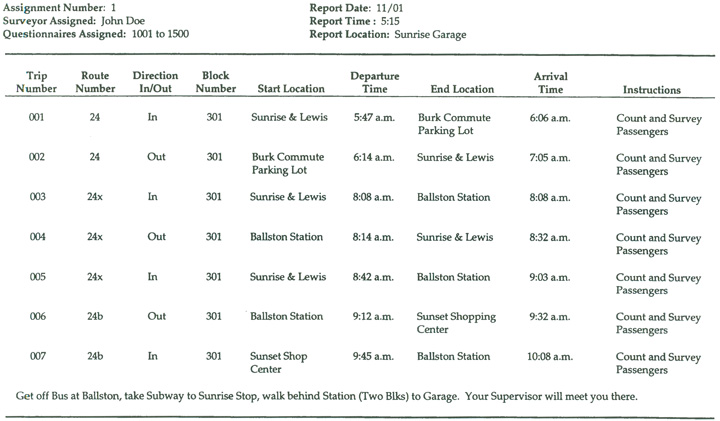
The survey planner should prepare surveyor assignment sheets once the blocks to be sampled are selected. As specified each block is broken into reasonable surveyor shifts and each trip per shift is tabulated for assignment. Table 18.5 illustrates a typical surveyor assignment sheet. In this case, the surveyor shifts consist of six to eight hours each.
16.5 Organization
Once the survey method and survey design have been established, the survey planner must develop an organization plan to help administer and conduct the transit onboard survey. The organization plan should consider the following elements:
- Staffing;
- Hiring methods;
- Training; and
- Supervision and data collection.
The intent of this organization plan is to provide the planner with proven guidelines to conduct a successful transit onboard survey. Obviously, the scale and magnitude of the survey varies according to available resources, travel demand modeling needs, and size of the metropolitan area and transit system. Therefore, the analyst may choose to emphasize particular elements of the organization plan to suit specific analysis needs. For example, a large system running 5,000 weekday bus trips in a high density urban environment would have different organizational needs than a smaller system running 700 weekday bus trips in a suburban area. The vital differences in field management include the average boardings and headway on each route, and therefore the number of surveyors necessary to conduct the surveys. The required elements of an organizational plan are described in the following sections.
16.5.1 Staffing Analysis
Analysis of the routes to be surveyed, the coverage, headways, and average boardings per time period should be conducted to determine specific survey staffing requirements. For example, the peak boardings may be so high as to necessitate one person simply to count boardings and another to hand out questionnaires. If interviews are being considered, peak loading may be so high as to keep the interviewer from moving freely through the bus to contact passengers. This can be overcome with the placement of interviewers in front and back, or by using a hand-out method with mail-back option. If certain routes have very high boarding and alighting volumes, indicating short trips by passengers, a mail-back option must be considered to protect a sample from a bias towards longer trips. For safety reasons, certain routes or certain hours of the day may require more than one surveyor per route.
Table 16.5 Example Surveyor’s Assignment Sheet
The basic steps presented below should be followed for this analysis:
- Identify the number of bus routes to be surveyed and their hours of operation. This information will establish the extent of route coverage of the transit system to be surveyed. It will also provide the analyst with specific surveyor needs associated with each bus route to be surveyed (based on the time each bus is in operation).
- Use existing GIS mapping (or other bus route maps) of the transit system to overlay on the existing roadway network. This mapping will identify the roadway locations of each bus route and stop locations, and identify potential locations for the survey operation center location.
- Identify the estimated boardings by time period for each specific bus route (or stratum if smaller than a route). Based on these ridership estimates, the planner can estimate the number of questionnaires handed out and the number of returns given an assumption of return rate. This is generally done in a worksheet file. The total number of questionnaires required to be handed out to achieve the stipulated number of returns is applied to the average boardings per bus trip to estimate how many trips in each time period must be surveyed. Remember that the total number of vehicle trips in each direction and time period should never be less than two.
- Identify the estimated number of inbound and outbound vehicle trips for each route to be surveyed. The planner should identify the start location (for the first set of a.m. trips this is generally a garage location) and end location for each bus trip. The supervisor can use the garage location as the meeting point and operations center for the early morning trips and as a pick-up point and operations center for the late evening trips. Garage locations are convenient start and end points for surveyors because parking is generally available. Midday relief of surveyors at bus layover locations must be coordinated very carefully so that the correct bus is surveyed.
- Establish surveyor assignments with unique numbers to cover each one-way outbound or inbound trip for each bus route to be surveyed. The unique numbers will ensure that each one-way direction trip segment will be coded and accounted for separately during fieldwork and data entry.
- Establish surveyor assignments to cover four- to nine-hour shifts. Using the time periods of the survey that were determined in the design, the shifts required to cover each route, and therefore the number of surveyors necessary to conduct the onboard survey, can be computed. If the run log or block log is used as the basis of sampling, then the surveyor can take short breaks with the driver. Lunch breaks may be avoided by using a six-hour shift.
- Establish a survey operations center location for the administration of the survey. Generally, this location is selected to serve as the logical place for the supervision and administration of the survey, and is generally in a central location. The administration center should have 24-hour access, since surveyors will be picking up their survey packs before the first trip in the morning (which may as early as 4:30 a.m.) and dropping off completed survey packs after their last trip in the evening (which may be 10:30 p.m. or later). The field supervisors are best given either morning or evening shifts.
Depending on the scale of the survey to be undertaken and the transit system to be surveyed, slight revisions to the above steps may be required. Through this analysis, the survey planner can determine the staffing requirements for the survey, including the number of surveyors and surveyor hours needed by route and the number of replacement surveyors by route.
16.5.2 Hiring Methods
Based on the staffing analysis conducted above, the survey planner’s next task will be to identify the methods for hiring transit onboard surveyors. The first step is to establish the start and end times of the survey period. As stated previously, typical survey schedules include the morning-peak, midday off-peak, afternoon peak, and evening operational periods. This generally covers 12 to 18 hours of the day and is representative of the typical weekday patronage.
The following options are considered:
- Contract with a (local) data collection firm to conduct and supervise the survey on a turnkey basis. The data collection firm is responsible for all aspects of the survey, including hiring surveyors, conducting, administrating, and supervising the survey in the field.
- Contract with a (local) data collection firm to conduct the survey fieldwork. The data collection firm is responsible for hiring surveyors and conducting the survey in the field. The project sponsor(s) is responsible for the survey’s office administration and for supervision of the data collection firm’s fieldworkers.
- Conduct the survey in-house. The project sponsor(s) has responsibility for recruiting and hiring surveyors, and conducting, administering, and supervising the survey in the field. In this case, the survey planners schedule interviews with prospective surveyors from various organizations such as college and university employment agencies, planning, and engineering departments; state and local government employment agencies; and private temporary employment organizations. Based on these interviews, the planners select the best qualified personnel who are available at the times required to carry out the survey. A written test is suggested as a way of testing the candidate’s ability to code numbers, read, and follow directions.
In most cases, hiring surveyors familiar with the transit system and bus routes to be surveyed is important, although the surveyor may need a car to get to the bus garage before the first bus leaves, or to return home after the last bus has gone back to the garage. If the planning agency contracts the work to a data collection firm, it is always beneficial for the survey planner to be involved in the initial administration and supervision of the survey during the pretest stage to assist, understand the procedures that are carried out, and to ensure that the surveyors and/or contractor are conducting the survey properly.
For information on hiring criteria for contractors, see Chapter 4.0. Sample onboard survey RFPs are shown in Appendix G.
16.5.3 Training Methods
Survey staff training should consist of a project briefing and a demonstration of the surveyor responsibilities. Using a bus during training allows the surveyors to get a feel for where equipment, such as the signs and boxes, belongs. Using other surveyors as surrogate passengers also allows each surveyor to familiarize him or herself with the procedures before real fieldwork begins. In addition, surveyors should be provided with the necessary materials and procedural notes to conduct the survey; an example of a Surveyor’s Manual of Procedures is available in Appendix H.
In cases in which data collection firms are hired to conduct the survey, it proves highly useful for the project sponsor(s) to assist in the training of survey administration and surveyor staff. The training generally takes a half-day, including orientation and role playing. Larger systems or surveys with personal interviews may take longer. Typical survey training procedural steps follow:
- Project Briefing – The project sponsor(s) should hold a project briefing for all hired survey staff (or contractor survey staff). This meeting should describe the background and purpose of the survey, as well as the administrative procedures to be followed during the course of the survey. At this point, all surveyors, including the “break” or replacement surveyors should be given their survey assignments and work schedules for the first days of work. Since there is a high turnover rate, especially in the first few days of surveying, the briefing and training demonstration should be videotaped to train replacement surveyors.
- Survey Demonstrations – The surveyors should be given individual demonstrations on the procedural conduct of the onboard passenger survey at this time. This includes describing the tasks of the surveyor regarding responsibilities for distributing survey materials to boarding passengers, tallying the total number of boardings and alightings at each bus stop location, and collecting the completed questionnaires. The surveyors should also role play the interview/survey distribution process to be certain they feel comfortable with the process and remember each of the steps. In one recent summary, interviewers were videotaped during the role play and asked to identify ways of improving.
- Survey Materials – Each surveyor should be given the appropriate survey materials and supplies at the start of his/her survey shift. Obviously, the materials provided to the surveyors are dependent on the scale of the survey to be undertaken. The materials identified below are intended to provide basic guidelines for surveys of this type:
- Individual packages containing a given number of questionnaires each;
- One box (or more) of golf pencils containing 144 pencils each;
- One (or more) large pencil eraser;
- One survey assignment sheet;
- One (or more) manila envelope per one-way bus trip with a survey log file enclosed;
- Bus route maps and schedules; and
- One large shopping bag for survey material storage purposes.
4. Survey Procedures – The surveyors should be provided with an outline (in writing) of the surveyor procedures described in the previous training sessions. In some cases, several copies of a letter describing the reasons for the survey may be enclosed with this package. The letter should be signed by the project sponsor(s). The purpose of this letter is to provide interested passengers with information about the survey. For specific surveyor tasks and procedures, please refer to the Surveyor’s Manual of Procedures in Appendix H. In addition, the surveyor will not be distracted from his/her responsibilities by answering questions about the survey that may be served through this letter.
The training methods identified in this section are intended to provide the basic guidelines to transit onboard survey administrators. In some cases, the planner should revise the parameters outlined above for their given survey situation.
16.5.4 Supervision and Data Collection
At the beginning of each bus route in the morning, the survey planner or data collection contractor should place individual surveyors on the appropriate buses, generally in the bus garage prior to the first vehicle trip. Depending on the scale of the survey, more than one morning and one evening survey supervisor should be scheduled during the course of the survey. Once each morning shift is placed on the correct bus, the morning supervisor is generally available at the administration or operations center to assist the surveyors with problems and other issues that arise throughout the survey day. The field supervisors might want to carry mobile phones to ensure their accessibility. Typical issues include providing surveyors with more questionnaires or pencils, coordinating survey shift changes, dealing with problems such as bus breakdowns, and generally managing the fieldwork throughout the day.
As each one-way bus trip is completed, all survey control (log) sheets and completed questionnaires should be enclosed in the manila envelopes provided to each surveyor. Each manila envelope should contain the specific one-way trip identification number for the given bus route and time-of-day. At the conclusion of the survey, each surveyor should provide all the survey materials and one-way trip manila envelopes to the survey supervisor.
The returned envelopes are taken to the administrative offices to be processed. The questionnaires are edited and coded, and entered into a data file as soon as possible after collection, allowing the monitoring of pass-out rates, response rates, refusal rates, and the completion of the trip log. If a surveyor is not being productive, or is conducting some element of the procedures incorrectly, that surveyor can be retrained or terminated before too many vehicle trips have been incorrectly run. As a result of these checks, low volume routes or time periods, strata with insufficient returns, or bus trips which failed due to surveyor misunderstanding or other problems (the bus broke down for instance), can be rescheduled for the last week of fieldwork.
16.6 Pretesting
The survey procedures and forms should be thoroughly pretested before the full survey is implemented. The survey planner should identify three to five bus routes with unique characteristics to test the survey instrument, surveyor organization, and survey response rates under different conditions. These conditions may include surveying for peak-periods and daily conditions on various bus routes to identify any problems that may arise through the conduct of the survey. Fully implemented survey procedures should be used on at least four one-way vehicle trips, including two outbound and two inbound trips. The pretest staff should include the designers of the survey procedures and forms, survey supervisors, and key surveyors hired to provide support in the fully implemented survey.
The surveyors conducting the pretest use the same procedures and techniques identified by the project analyst during the survey training sessions. For example, the surveyor boards the selected bus, counts the boarding passengers, hands out questionnaires to each boarding passenger, collects the completed questionnaires, encloses the completed questionnaires in the appropriate trip envelope, completes the information for the one-way directional trip, and prepares for the next one-way directional trip.
After completing the pretest, the survey planner(s) should hold a debriefing meeting to jointly identify any discrepancies in the survey procedures. The survey control (log) sheets should be rigorously examined after the pretest for discrepancies and uncontrolled information. The information contained in the returned questionnaires should also be processed immediately to identify any potential problems associated with respondents filling out the survey properly. Frequency distributions should be conducted on each question to determine the validity of the survey instrument. If the valid responses fall below 95 percent, then the question should be reworded. The only questions that should have a significant percentage of blank (or a non-response) responses are the socioeconomic questions related to age, sex, ethnic background, and income.
16.7 Administration Issues
As specified above, the organization of the transit onboard survey includes staffing analysis, hiring methods, training methods, and supervision and data collection. Additional administrative support issues should be considered by the project sponsor(s) before the survey is implemented. The requirements for this administrative support are described below:
- Develop the necessary forms such as the questionnaires, bus trip logs, surveyor assignment sheets, and control registers (used to maintain the status of sampled bus trips);
- Provide survey personnel (by making sure surveyors will show up at their scheduled times);
- Develop a manual of survey instructions;
- Develop and conduct the surveyor training program;
- Specify and assemble survey materials sufficient for the field crew anticipated plus 20 percent. Include surveyor badges, pencils and clipboards, envelopes, return boxes and pencil boxes. Provide “Survey Today” signs for the bus window, and shopping bags (or carry-on bags for survey material);
- Conduct the pretest; and
- Acquire the appropriate bus or transit passes for each surveyor.
Daily administrative support is also required, which includes the following:
- Assemble surveyor’s equipment for each oncoming shift, disassemble and log in surveyor’s equipment with completed questionnaires from each completed shift;
- Organize/review and conduct edits on the completed surveyor’s packets from the previous day;
- Keep productivity records for each surveyor, check for cheating, retrain and/or terminate as necessary;
- Check for missed/incomplete/failed trips and reassign such trips for resurveying; and
- Check return rates and completion rates (the number of returns which pass editing) by route and/or stratum to ensure that sample assumptions are being met. Schedule routes with poor returns for resurveying.
16.8 Coding and Data Entry for Transit Onboard Surveys
If mailback or other self-completion survey forms are used in the survey effort, the responses need to be assigned codes for data entry. Closed ended question forms and precoded forms simplify this process greatly, so that the coding and data entry can be performed simultaneously. However, even if precodes are present, a questionnaire with complex questions or open-ended responses should be formally coded prior to data entry. The principles of coding are described in Chapter 2.0
Once all responses have been coded, the data from all self-completion forms and PAPI interview forms should be entered into data files. Survey data are most commonly entered in ASCII flat files, with specified character columns for each coded response. Alternatively, the survey data can be entered directly into database or spreadsheet software packages. The packages can be manipulated to provide user-friendly data entry displays and reasonableness checks on entered data.
It is usually cost-effective to validate all data entry by having different data entry specialists enter the same data. The small additional cost of entering all data twice is almost always preferable to the costs (monetary and time) of sorting out errors during the editing task
16.9 Cleaning and Editing
The questionnaires for each completed one-way trip should be edited as soon after collection as possible in order to ensure that each surveyor is using proper procedures. At the end of each day, the trip envelopes should be opened and the trip logs edited for completeness. The number of boarding passengers should be compared to the number of questionnaires handed out (using the questionnaire serial numbers). Optimally, this difference should be zero. The project analyst(s) should make certain that the boardings are not lower than the distributed number of questionnaires.
The number of completed questionnaires, refusals, and blanks should be tallied for each trip. Higher than average refusals necessitate a discussion with the surveyor for that trip. There could be a reason one trip had a high refusal rate, or the surveyor may require retraining. Once the editor is satisfied that the trip information is complete, the questionnaires returned for that trip are sorted. Refusals and blanks can be discarded while the completed questionnaires should be sent for data entry. A completed questionnaire may not have all questions answered. Therefore, the rules to identify a usable questionnaire should be given to the editors. Generally, a questionnaire is usable if the origin and destination of the trip are filled in and codable. If the origin and/or destination is blank, but the access or egress made is walking, the boarding bus stop or the alighting bus stop could be substituted as the ultimate origin and destination of the trip. This determination should be made by the survey design staff.
Cleaning the data once it is entered begins with range checks. For example, if the possible answers to a question are numbered 1 to 4 and the non-response is coded as 0, then all answers greater than 4 must be erroneous. In addition, certain cross checks must be performed to verify the accuracy of the data. For example, if the answer for the number of buses used to complete the trip is one, then the answer for access or egress mode cannot be bus. Conversely, if the answer to access or egress mode is bus, then the number of buses to complete this trip must be more than one. Similarly, if the fare type is transfer, the access mode must be bus, and the number of buses to complete the trip must be more than one. These types of checks are called logic and consistency checks.
For access mode/egress mode questions that specify transfers to or from a route, checking involves consulting the bus system map to see that a transfer from the bus route(s) listed is possible at the point where the passenger boarded the current bus.
The 1972 Urban Mass Transportation Travel Survey Manual discusses the types of errors usually encountered (U.S. Department of Transportation, Urban Mass Transportation Administration, 1972):
- Omissions where either the interviewer or the respondent (in a self-administered survey) failed to make an entry – Sometimes it may be possible for the editor to complete the form, on the basis of other entries on it. For example, if the omission is “the time boarded the vehicle,” it may be possible to estimate the time from survey control information. If the survey cards are serialized and specific batches of cards were distributed within a certain known time period, an estimate of the time could be made by analyzing the information related to where the person boarded the vehicle. Great caution must be used when inserting information , to be sure that no guesses are made. The indiscriminate insertion of data could lead to numerous erroneous conclusions. For example, there is no way to determine if the respondent is a male or a female unless that information is recorded. Therefore, no attempt should be made to guess at what the proper entry should be.
- Impossible entries – An example of an impossible entry might be the recording of an address in an area that is not within a reasonable distance from the transit boarding place, when the respondent indicated that he walked to the boarding place. In this case, the respondent may have driven to a transit station, but incorrectly identified his means of getting there as “walk,” instead of “auto.” He may have misunderstood the question, and recorded his home address instead of the actual place where he boarded the vehicle.
- Inconsistent entries – These occur when two or more entries must bear a particular relationship to each other, but do not. For example, the addresses recorded for “boarding address” and “alighting address” may be reversed. If the survey is related to “inbound” trips only, a suburban address for “boarding address” is more reasonable than an address close to the central business district.
- Unreasonable magnitudes of entries which might not necessarily be wrong, but which appear unreasonable – For example, if the response to the question: “How many autos are available for your use at your home” is recorded as “20,” it may be safe to assume that “2” was the intended response.
Before proceeding with data expansion, it is important to spend some time reviewing the results and conducting enough cross-tabulations to insure the data are correct before expanding the sample to reflect the entire population.
Required Data for the Survey to Be Useable
Origin address and type of place
Transfers (all routes used) to get to the current route from origin
Mode of access to the transit system
Boarding address
Alighting address
Transfers (all routes used) to get to from current route to destination
Mode of egress from the transit system
Destination address and type of place
Home address
Number of autos available in household
Household size
Number of adults in household
Number of workers in household
Respondent’s employment status
Respondent’s student status
Driver’s License status
Age of respondent
Annual Household Income
Time of Day
Optional Data
Distance/time walked from origin to the transit system (if applicable)
Park and ride location (if applicable) on either end of the trip
Distance/time walked from the transit system to destination (if applicable)
Frequency of transit use
How often the trip is made
Fare payment method
Auto availability for this trip
Hispanic origin
Race
Ability to speak English
Gender
Employment address if not provided as an origin/destination
School address if not provided as an origin/destination
(if employed) Whether the respondent will go to work later in the day if
he/she did not report work as an origin/destination
(if a college student) Whether the respondent will go to college later in the
Prior to geocoding, it is important to perform the following checks on the data:
- The list of bus stops along a route needs to be precoded to ensure accurate geocoding of all boarding and alighting locations.
- Place names and street addresses are properly and consistently spelled
- The number of household occupants is greater than or equal to the number of employed members of the household and the number of adults in the household
- The number of household occupants is greater than or equal to the adults in the household
Once the initial cleaning and processing activities have been completed, the following should be geocoded to X,Y coordinates and the nearest TAZ.
- Home address
- Origin address
- Destination address
- Boarding address
- Alighting address
- Employer address (if provided)
- School address (if provided)