Home / Chapter 25

Chapter 25


CHAPTER 25.0 COSTS AND TRIP RATES OF RECENT HOUSEHOLD TRAVEL SURVEYS

Note: Significant components of this chapter come from The Hartgen Group’s report, Household Travel Survey Costs and Trends, 1988 – 2009. The paper is prepared by David T. Hartgen and Elizabeth San Jose. The original report can be accessed online through the Hartgen Group’s website, http://www.hartgengroup.net/Projects/National/USA/household_travel_summary/2009-11-11_Final_Report_Revised.pdf

Are you planning a travel survey for your region? Learn what others have experienced.

  • How big a sample is typical for cities like mine?
  • What do surveys cost, for cities like mine?
  • Do costs vary geographically?
  • Are costs increasing over time? How fast?
  • How much do ‘activity’ or ‘trip’ formats cost?
  • What cities have recently done 2-day surveys?
  • What is the cost for a second day?
  • What cities have recently done weekend days?
  • What cities have used GPS or web-based designs?
  • What are typical trip rates for cities like mine?
  • Are trip rates increasing or decreasing over time?
  • What is the range of average trip rates, for cities like mine?

25.1 Overview

Travel surveys are a staple of transportation planning. They are conducted regularly by regional planning agencies and states, sometimes in conjunction with larger national surveys. Their primary uses are in describing local travel patterns, updating travel models, evaluating major project proposals and monitoring travel trends.

Because of their wide communality, several reviews of travel surveys have been conducted, and several manuals of practice prepared. The University of MinnesotaUniversity of Minnesota). Stopher et. al. summarized the state of the practice in travel surveys, concentrating on survey methodology, question format and categories, and data processing-coding (Stopher et. al., 2008). The Travel Survey Committee of TRB has recently initiated the wiki-edited development of a revised survey manual (Transportation Research Board, 2009) building on Stopher’s work. In a 1996 report (Stopher, 1996), Stopher and Metcalf synthesized the methods used in 55 travel surveys conducted primarily in the 1970s and 1980s. Also in 1996, Cambridge Systematics Inc (Cambridge Systematics Inc., Travel Survey Manual, 1996). prepared a detailed manual on the conduct of various travel surveys; the Appendix A to this document discusses cost estimation principles, quotes a widely-noted $ 100/household rate, and gives examples of cost calculations for external surveys. In a slightly later review, TMIP (DOT and EPA, 1997) summarized the characteristics of 55 largely US travel surveys. In 1995 Axhausen (Axhausen, 1995) prepared an international ‘survey of surveys’ summarizing the question structure of a large number of primarily European-Australian travel surveys, but including about 15 from the US. Richardson et. al. (Richardson et. al., 1995) provide guidance on travel survey design; and an earlier USDOT overview (U.S. Department of Transportation, Federal Highway Administration, 1973) provides documentation of survey methods from the 1960’s. As useful as these documents are, however, none provide basic empirical cost information needed to efficiently plan surveys. As newer methods and an increasing focus on ‘activity’ surveys emerge, it is useful to have a periodic assessment of the cost of these surveys and an overview of their results. has recently established a repository for travel survey data and reports which contains information on about 73 surveys (Center for Transportation Studies,

This brief report is intended to summarize, in shorthand form, the costs and primary results from about 115 travel surveys, in a range of metropolitan areas from the largest down to very small regions, and about 17 ‘statewide’ surveys. Most of the surveys are from the US, but a few are from Canada and overseas. They cover many (but certainly not all) surveys conducted over a 20-year period, from 1988 to 2009. The review focuses on ‘administrative’ data for survey planning purposes:

  • Costs and ‘unit’ (per completed sample) costs.
  • Cost trends over time
  • Cost estimation models.
  • Sample sizes.
  • Survey types.
  • Household and person trip rates.
  • Trip rate trends over time.
  •  Contact names and emails.

This review is not intended for detailed planning or questionnaire design, or detailed results comparison. For that, the University of Minnesota website is a useful resource, with primary documents. Rather, it is intended to provide basic planning information needed to begin the process of survey design, and to provide contact names for particular survey features that may be of interest.

This review is being updated regularly, and therefore the authors would appreciate other surveys, and of course revisions, being brought to their attention.

25.2 Results

The following graphics and brief points summarize the primary findings of the review. These findings are preliminary, since they are continually being updated.

25.2.1 Descriptive

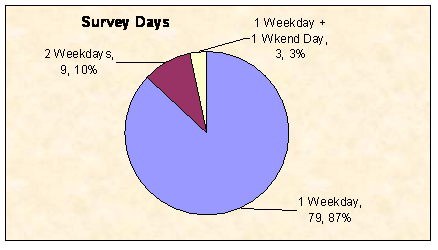
Most travel surveys continue to be 1-day weekday surveys, although a few (9 of 91 reporting) are for 2 weekdays, and 3 are for weekdays and one weekend day. However, most of the surveys not reporting this statistic (about 24) are likely to be 1-day weekday surveys.

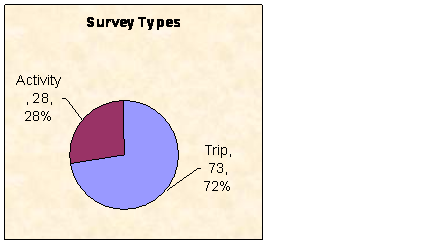
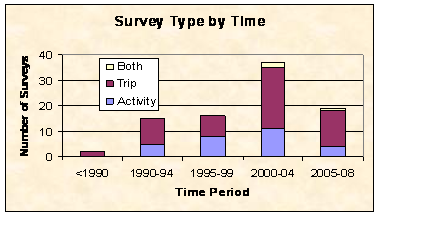
‘Activity’ format surveys are about 1/3 of the total but are increasing relatively over time; about 28 surveys were reported as ‘activity’ focused, and about 73 as ‘trip’ focused.


       25.2.2 Nominal Costs 

Comparative survey costs are difficult to determine since surveys vary widely in length, content, planning and processing. We used here, the contract survey costs, which normally include design, sampling, training and conduct, and also typically include documentation, some coding and processing but not modeling.

Based on our review, we estimate the average cost of a survey at about $ 487,000, implying a total 2-decade survey budget of about $ 194.8 million for 400 regions, or about $ 9.7 million annually. This is somewhat higher than Stopher and Metcalf’s estimate of $ 7.4 million annually<!--[if !supportFootnotes]-->[1]<!--[endif]-->, in 1996. 

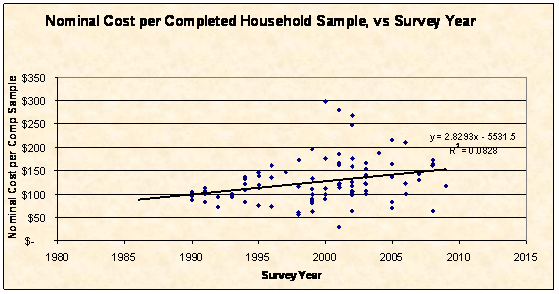
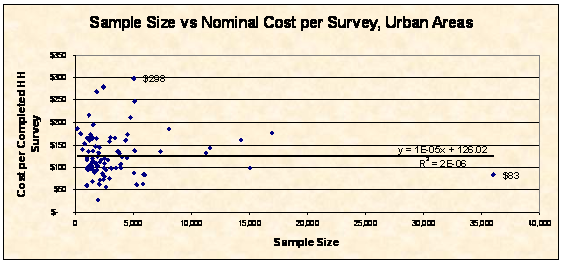
The nominal (year of survey) unit costs for household travel surveys have been rising over time, from about $ 105 per completed sample in the late 1980’s, to an average of about $ 150 per completed sample, recently. However, many surveys cost considerably more than the average, and the spread of the data is substantial. During this period, survey costs have increased about $ 2.83 per sample per year. However, this increase includes inflation.


Survey costs decline very slightly with increasing sample size, a very small ‘economy of scale’.

25.2.3 Survey Costs Adjusted for Inflation

However, when adjusted for inflation (i.e., what the survey would have cost if conducted in 2007, using national CPI growth rates), survey costs are estimated to average about $ 529,000 in 2007 dollars, implying a ‘going forward’ annual national cost of travel surveys of about $ 10.6 million annually.

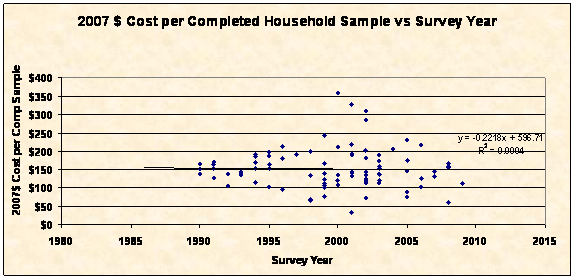
The average 2007 cost per completed sample has actually declined slightly over the past several decades, from about $ 155 per completed sample in 1990 (in $2007) to about $ 151 in 2008, a decline of about $ 0.22 per year over the past two decades. However many recent surveys conducted since 2000 have cost much more than the average, some as much as $ 300-$350 per sample.

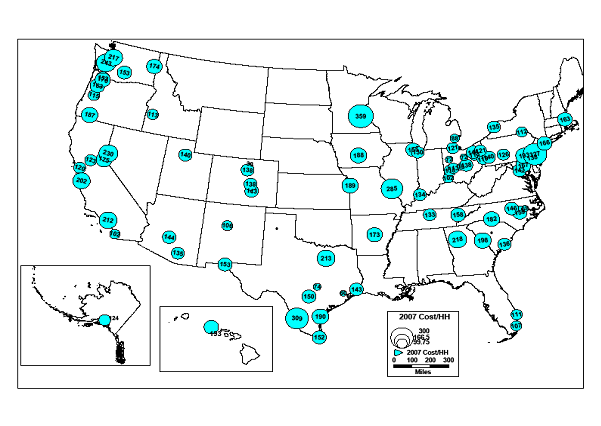
The geographic distribution of unit survey costs (2007$) is shown in the following figure. While there is clearly some slight tendency for ‘mid-US’ surveys to cost less, per completed sample, than ‘coast State’ surveys, the effect is probably not significant. Nevertheless, the tendency of large-city ‘coastal’ cities to cost more, per unit, cannot be overlooked. More research is needed to determine whether this is a ‘cost-of business’ effect, or perhaps something related to survey length or other factors.


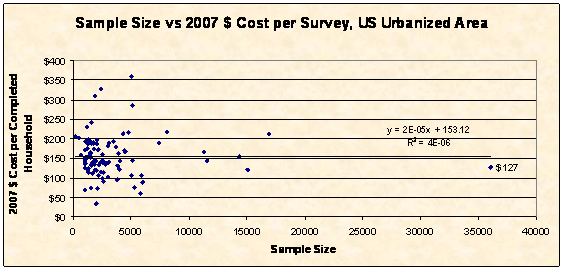
Unit costs for surveys decline with increasing sample size. For surveys of about 500-600 samples, costs in the range of $ 140-160 per completed sample might be typical, while for larger surveys, in the 1000-sample range, costs range from $ 100-$ 250/sample. Generally, costs per sample decline by about $0.02 for each increased sample.

However when adjusted for $ 2007 prices, the relationship is flatter; per-sample costs decline about $0.01 for each added sample. However, both relationships are quite weak.


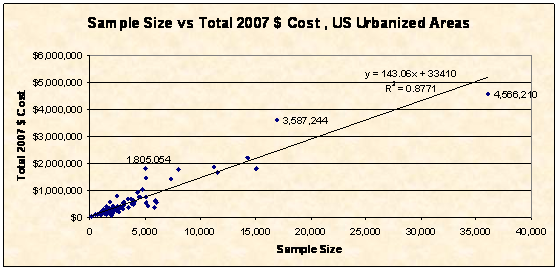
As expected, total survey costs ($2007) increase linearly with sample size. The following graphic suggests that the increase is about $ 143 per completed sample, with a ‘base’ cost of about $ 34,000. So, a 1000-completed sample survey might be expected to cost about $ 177,000 or about $ 177/completed sample.

The following two ‘2007$ cost models’ have been developed from the 78 surveys for which full data is available:

2007 $ Total survey cost =  - 30440

 + 11.74 Pop07K (regional population) 

 + 133.90 Sample Size

 + 93716 (Number of Survey Days: 1, 2, ..)

  - 75718 (“1” if “activity” format)

  N = 78

 RSQ = 0.90

2007$ Unit survey cost (per completed household)

   = 121.11

 + 0.0014 Pop07K

  ­- 0.0007 Sample Size

 + 29.71 (Number of Survey Days: 1, 2, ..)

 - 20.33 (“1” if “activity” format)

 N = 78

 RSQ = 0.06

While the first model is stronger, it is an ‘aggregate’ model based on total costs. The second model, estimating per-sample costs, may be more useful for planning.

A simple example will illustrate the use of these models. Consider a proposed household survey, one-day, activity format, 1000 households, for a region of 1.5 million persons. The estimated cost is:

Total Cost = - 30440 + (11.74)(1500) + (133.9)(1000) + (93716)(1) –(75718)(1)

   = $ 139,068, or $ 139.07 per completed sample.


Unit cost = 121.11 + (0.0014)(1500) – (0.0007)(1000) + (29.71)(1) – (20.33)(1)

  = $ 131.89, or $ 131,890 for 1000 samples.

The effect of extra days’ in these models is interesting. In the first, the addition of a second day would add about 67% to the total cost. In the second model, adding an additional day would add about 23% to the total survey cost.


25.2.4 Household Trip Rates

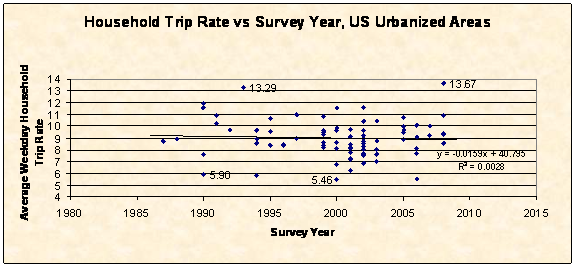
Average weekday household trip rates have been quite stable, on average, over the past 2 decades, averaging about 9 trips per household, with many surveys, however, reporting somewhat higher or lower rates. Household trip rates seem to have fallen slightly over the past 20 years, from about 9.1 in 1990 to about 8.9 in 2008. However, the variation in rates is very large, and this may be merely the effect of variation in regional demographic and survey procedures, along with generally declining household size.

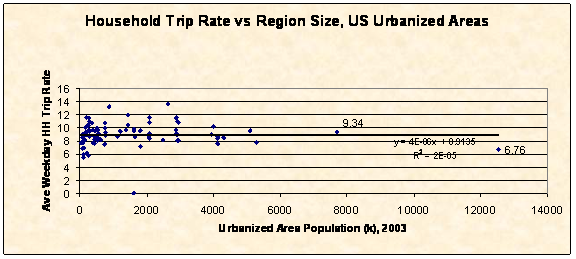
There is some evidence that trip rates are slightly lower in larger regions. Trip rates seem to average about 8.9 for small regions, declining to about 8.75 for regions with 15 million persons. This effect is therefore quite small, about 1.7% difference (-0.15) between the smallest and largest regions. If true, it might be a combination of density and possibly demographic (income and household size) effects. The spread of the data is substantial.

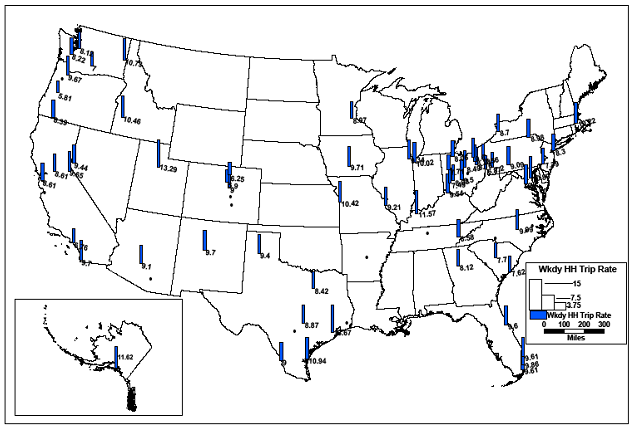
While household trip rates vary quite widely, there is no obvious evidence that this is a geographic phenomenon. The following figure shows average trip rates for cities reporting across the US. The figure suggests that average trip rates seem to be a function of regional demographics rather than US location.

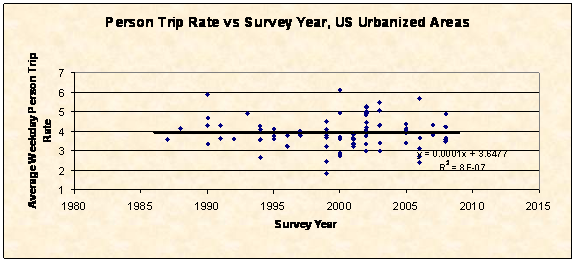
25.2.5 Person Trip Rates

Average weekday person trips also seem to be largely stable over time. Over the past 2 decades, the average weekday person trip rate has been essentially flat, at about 3.90 – 4.00 trips per person.

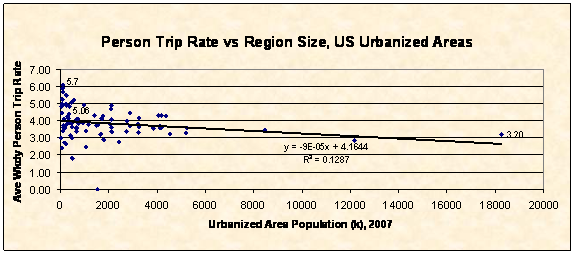
Person trip rates seem to be somewhat more sensitive to region size than household trip rates. On average, person trip rates decline from about 4.16 in small regions to about 3.2-to-3.6 in very large regions. They seem to decline slowly with increasing region size. This might be the result of smaller family sizes in large regions (imposing, on average, fewer travel-related activities), possibly different demographics (income), or possible density effects producing higher walk-bike shares which are often not surveyed in travel surveys. However, as in most of the relationships, the model is weak with considerable variation.

The following table summarizes basic administrative information and costs for the surveys in the study. We appreciate the efforts of many MPOs, consultants and others in providing this information. We would appreciate being informed of other surveys not listed, or new surveys underway, particularly those using innovative survey methods. We hope to update this listing regularly.


Administrative Summary of Recent Travel Surveys, Oct 27, 2009, The Hartgen Group, www.hartgengroup.net 

Region or State

State Prov

2007 Pop K

Survey Year

Compl Sample Size

Nominal Cost per Compl Sample

Survey Days

Survey Type

Ave Wkday HH Trip Rate

Ave Wkday Person Trip Rate

Agency Contact

Contact Email

US Urbanized


NY-NJ Metro

NY

18223

2009

in progr


Jorge Argote

jargote@dot.state.ny.us

NY-NJ Metro

NY

18223

1999

11,264

 $ 133

1 WD

Activity

8.30

3.20

Jorge Argote

jargote@dot.state.ny.us

Los Angeles Area, Southern CA

CA

12171

2000

16,939

 $ 176

1 WD

Trip

6.76

2.83

Javier Minjares

minjares@scag.ca.gov

Los Angeles Area, Southern CA

CA

12171

1991

36,037

 $  83

1 WD

Trip

0.00

0.00

Javier Minjares

minjares@scag.ca.gov

Chicago Area

IL

8467

2008

14,315

 $ 161

1WD 1WE

Activity

9.34

3.47

Sandy Perpignani

sperpignani@cmap.illinois.gov

Miami-Dade Area, Southeast FL

FL

5244

2000

5,067

 $ 89

1 WD

Trip

9.61

3.60

Jose Luis Mesa

jlm1@miamidade.gov

Miami Area

FL

5244

1998

2,650

 $ 57

1 WD

Trip


Jose Luis Mesa

jlm1@miamidade.gov

Philadelphia

PA

5178

2001

2,425

 $ 279

1 WD

Trip

7.79

3.30

Matthew West

mwest@dvrpc.org

Dallas Area

TX

4549

1996

4,338

 $ 161

1 WD

Activity

8.42

3.24

Francisco Torres

ftorres@nctgoc.org

Houston/ Galveston Area

TX

4370

2008

5,810

 $ 63

1 WD

Activity

13.67

4.25

Sharon Ju

sharon.ju@h-gac.com

Houston/ Galveston Area

TX

4370

1996

2,443

 $ 73


Chris Van Slyke

chris.vanslyke@h-gac.com

Washington Area

DC

4174

2007

11,578

 $ 143

1 WD

Trip

9.20

4.30

Clara Reschovsky

creschovsky@mwcog.org

Washington Area

DC

4174

2004

150

 $ 187


Clara Reschovsky

creschovsky@mwcog.org

Washington, DC Area

DC

4174

1994

4,865


1 WD

Trip

8.57

3.59

Clara Reschovsky

creschovsky@mwcog.org

Atlanta Area

GA

4118

2001

8,069

 $ 186

2WD+Sat

Both

8.12

3.58

Guy Rousseau

grousseau@atlantaregional.com

Atlanta Area

GA

4118

1991

2,138

 $ 112

1 WD

Trip

10.90

3.67

Guy Rousseau

grousseau@atlantaregional.com

Boston Area

MA

4078

1991

3,906

 $ 107

1 WD

Activity

10.22

4.31

Karl Quackenbush

karlq@ctps.org

Detroit Area

MI

3832

2005

6,000

 $ 83


Carmine Palombo

palombo@semcog.org

Detroit Area

MI

3832

1994

7,361

 $ 136

1 WD

Trip

8.90

3.57

Carmine Palombo

palombo@semcog.org

Phoenix Area

AZ

3255

2001

4,018

 $ 123

1WD 1WE

Trip

9.10

3.64

Dr. Vladimir Livshits

vlivshits@mag.maricopa.gov

Phoenix Area

AZ

3255

1988

2,993


1 WD

Trip

8.93

4.14

Dr. Vladimir Livshits

vlivshits@mag.maricopa.gov

San Francisco Area

CA

3214

2000

15,064

 $ 100

2 WD

Activity

8.61

3.74

Chuck Purvis

cpurvis@mtc.ca.gov

San Francisco Area

CA

3214

1996

3,678

 $ 136

2 WD

Activity

8.40

3.78

Chuck Purvis

cpurvis@mtc.ca.gov

San Francisco Area

CA

3214

1990

9,359


1 WD

Trip

7.56

3.33

Chuck Purvis

cpurvis@mtc.ca.gov

Seattle Area

WA

2897

2006

4,746

 $ 211

2 WD

Activity

8.12

3.67

Neil Kilgren

nkilgren@pscr.org

Seattle Area

WA

2897

1999

5,874

 $ 85

2 WD

Activity

10.83

4.47

Neil Kilgren

nkilgren@pscr.org

San Diego Area

CA

2748

2006

3,536

 $ 99

1 WD

Trip

9.70

4.01

Kristen Rohanna

kroh@sandag.org

San Diego Area

CA

2748

1995

2,055

 $ 145

1 WD

Trip

9.20

3.35

Kristen Rohanna

kroh@sandag.org

San Diego Area

CA

2748

1986

1,107


1 WD

Trip

11.60


Kristen Rohanna

kroh@sandag.org

Minneapolis- St. Paul Area

MN

2438

2000

5,032

 $ 298

1 WD

Trip

8.07

2.76

Mark Filipi

mark.filipi@metc.state.mn.us

Baltimore Area

MD

2133

2008

4,500

 $ 173

1 WD

Trip

10.89

4.90

Robert Berger

rberger@baltimetro.org

Baltimore Area

MD

2133

2001

3,456

 $ 165

1 WD

Trip

8.45

3.37

Robert Berger

rberger@baltimetro.org

Baltimore Area

MD

2133

1987

2,692


1 WD

Trip

8.71

3.58

Robert Berger

rberger@baltimetro.org

St. Louis Area

MO

2103

2002

5,094

 $ 248

1 WD

Trip

9.21

4.08

Les Sterman

les.sterman@ewgateway.org

St. Louis Area

MO

2103

1990

1,446

 $ 104

1 WD

Trip

11.56

4.69

Les Sterman

les.sterman@ewgateway.org

Denver Area

CO

2088

1997

3,824


1 WD

Trip

9.00

3.80

Erik Sabina

esabina@drcog.org

Ft. Lauderdale Area

FL

1800

2000

5,168


1 WD

Trip

9.86

2.90


Portland Area

OR

1780

1994

4,451

 $ 121

3 WD

Activity

9.67

4.29


Cleveland Area

OH

1706

1994

1,408


1 WD

Trip

9.60

4.10

Renee Daniels

rdaniels@mpo.noaca.org

Pittsburgh Area

PA

1688

2001

2,500

 $ 120

1 WD

Trip

7.20

3.20

Kristin Baum

kbaum@spcregion.org

Cincinnati Area

OH

1547

2009

In proc


GPS Veh tracking

Trip


Andrew Rohne

arohne@oki.org

Cincinnati Area

OH

1547

1995

3,000

 $ 75

1 WD

Trip

9.54

3.77

Andrew Rohne

arohne@oki.org

Sacremento Area

CA

1489

1999

3,942

 $ 99

1 WD

Trip

8.61

3.70

Matt Carpenter

mcarpenter@sacog.org

San Antonio Area

TX

1441

1990

2,643

 $ 95


Stephanie Lee

slee@sametroplan.org

Kansas City Area

MO

1409

2003

3,049

 $ 167

1 WD

Trip

10.42

4.29

Mell Henderson

mellh@marc.org

Kansas City Area

MO

1409

1990

1,221


1 WD

Trip

11.97

4.30

Mell Henderson

mellh@marc.org

Columbus Area

OH

1175

1999

5,300

 $ 61

1 WD

Trip

9.50

3.80

Robert Lawler

rlawler@morpc.org

Austin Area

TX

1052

2005

1,499

 $ 70

1 WD

Trip

8.87

3.42

Michael Dutton

michael.dutton@campotexas.org

Austin Area

TX

1052

1999

2,500

 $ 80

1 WD

Trip

9.27

2.45

Michael Dutton

michael.dutton@campotexas.org

Salt Lake City Area

UT

970

1993

3,082

 $ 97

1 WD

Activity

13.29

4.91

Wayne Bennion

wbennion@wfrc.org

Buffalo Area

NY

927

2002

2,779

 $ 117

1 WD

Trip

8.70

3.89

Hal Morse

hmorse@gbnrtc.org

Charlotte Area

NC

913

2002

3,000

 $ 158


Joe McLelland

jwmclelland@ci.charlotte.nc.us

Nashville Area

TN

816

1998

2,200

 $ 116


Michael Skipper

skipper@nashvillempo.org

Tucson Area

AZ

779

1993

1,913

 $ 94


Cherie Campbell

ccampbell@pagnet.org

Gary Area

IN

750

2007

3,838

 $ 130

1WD 1WE

Trip

10.02

3.83

Bill Brown

wbrown@nirpc.org

Gary Area

IN

750

1995


Bill Brown

wbrown@nirpc.org

Honolulu/ Oahu Island

HI

735

2001

1,500

 $ 165


Lori Arakaki

lori.arakaki@oahumpo.org

Honolulu/ Oahu Island

HI

735

1995

4,060


1 WD

Trip

10.69

4.10

Lori Arakaki

lori.arakaki@oahumpo.org

El Paso

TX

693

1994

2,510

 $ 110


Roy Gilyard

rgilyard@elpasompo.org

Dayton Area

OH

683

2002

1,950

 $ 103

1 WD

Activity

7.49

3.35

Ana Ramirez

aramirez@mvrpc.org

Albuquerque Area

NM

681

1992

2,155

 $ 72

1 WD

Trip

9.70

3.60

Nathan Masek

nmasek@mrcog-nm.gov

Raleigh-Durham

NC

670

2005

5,107

 $ 137

1 WD

Trip

9.99

4.06

Joe Huegy

jbhuegy@ncsu.edu

Raleigh Area

NC

670

1994

2,045

 $ 133

2 WD

Activity

8.50

3.54

Joe Huegy

jbhuegy@ncsu.edu

Akron Area

OH

567

2002

1,936

 $ 125

1 WD

Activity

8.24

5.22

Amy Pater

prateam@ci.akron.oh.us

Palm Beach Area

FL

501

1999

1,676

 $ 89

1 WD

Activity

9.61

1.83

Robert Weisman

public@co.palm-beach.fl.us

Wilmington Area

DE

500

2003

1,000

 $ 122


Dave Racca

dracca@udel.edu

Toledo Area

OH

484

2003

1,869

 $ 107

1 WD

Activity

8.06

5.06

Marc Vondeylen

vondeylen@tmacog.org

Charleston Area

SC

466

2003

1,000

 $ 121

1 WD

Trip

7.62

3.00

Ron Mitchum

ronm@bcdcog.com

Knoxville Area

TN

465

2008

1,400

 $ 164

1 WD

Both

8.58

3.64

Michael Conger

mike.cogner@knoxtrans.org

Knoxville Area

TN

465

2001

1,538

 $ 113

1 WD

Both

8.21

3.84

Michael Conger

mike.cogner@knoxtrans.org

Columbia Area

SC

416

2006

1,000


1 WD

Trip

7.70

3.13


Des Moines Area

IA

388

2001

1,231

 $ 161

1 WD

Trip

9.71

3.90

Tom Kane

tjkane@dmampo.org

Youngstown Area

OH

383

2002

1,251

 $ 105

1 WD

Activity

7.56

4.83

Kathleen Rodi

krodi@eastgatecog.org

Little Rock Area

AK

366

2003

856

 $ 153


Jim McKenzie

mckenzie@metroplan.org

Spokane Area

WA

363

2005

1,828

 $ 164

1 WD

Trip

10.73

4.39

Glenn Miles

contact.srtc@srtc.org

Augusta Area

GA

340

1998

1,300

 $ 173

1 WD

Trip


George Patty

gpatty@agustaga.gov

Lancaster Area

PA

337

2008


Janet Wall

jwall@padutchcountry.com

Lancaster Area

PA

337

2001

1,000

 $ 165


Janet Wall

jwall@padutchcountry.com

Lake Tahoe Basin Area

NV
CA

332

2005

1,220

 $ 165

1 WD

Activity

9.65

3.90

Nick Haven

nhaven@trpa.org

Reno Area

NV

332

2005

1,200

 $ 217

1 WD

Trip

9.44

4.13

Peter Bang

pbang@rtcwashoe.com

Reno Area

NV

332

1990

1,050

 $ 95

1 WD

Trip


Peter Bang

pbang@rtcwashoe.com

Vancouver WA Area

WA

330

1995

1,500

 $ 112


Shinwon Kim

shinwom.kim@rtc.wa.gov

Boise Area

ID

311

2002

2,582

 $ 98

1 WD

Trip

10.46

4.22

Mary Waldinger

mwaldinger@compassidaho.org

Corpus Christi Area

TX

301

1997

1,712

 $ 147

1 WD

Activity

10.94

4.00

Victor Mendieta

victormendieta@swbell.net

Canton Area

OH

260

2003

1,319

 $ 100

1 WD

Activity

8.76

5.49

Bob Nau

ranau@co.stark.oh.us

Daytona Beach Area

FL

260

2002

1,397


1 WD

Trip

9.60

4.92

Karl Welzenbach

staff@volusiacountympo.com

Anchorage Area

AK

239

2002

1,293

 $ 107

1 WD

Trip

11.62

4.96

Craig Lyon

lyonch@muni.org

Eugene Area

OR

237

1994

2,415

 $ 82

2 WD

Activity

5.81

2.64

Andrea Riner

ariner@lcog.org

Salem Area

OR

229

1995

1,500

 $ 120


Richard Schmid

rschmid@mwvcog.org

Ft. Collins (North Fr Range)

CO

221

2001

1,958

 $ 29

1 WD

Trip

6.25


Arvilla Kirchhoff

akirchhoff@nfrmpo.org

Evansville Area

IN

216

2000

1,800

 $ 111

1 WD

Trip

11.57

4.94

Bradley Mills

bmills@evansvillempo.com

Laredo Area

TX

212

2002

1,838

 $ 268

1 WD

Trip

9.00

3.75

Charlie Hall

cdhall@dot.state.tx.us

Brownsville Area

TX

202

2006


10.07

2.72

Mark Lund

bmpo@cob.us

Brownsville Area

TX

202

1991

1,500

 $ 100


Trip


Mark Lund

bmpo@cob.us

Amarillo Area

TX

190

2008

1,521


1 WD

Trip

9.40

3.60

Charlie Hall

cdhall@dot.state.tx.us

Salinas Area

CA

167

2002

500

 $ 176


Bhupendra Patel

bpatel@ambag.org 

Olympia Area

WA

163

1999

1,537

 $ 195

2 WD

Trip

8.22

4.11

Thera Black

blackvt@trpc.org

Medford (Rogue Valley)

OR

140

1995

1,550

 $ 138

2 WD

Activity

8.39

3.61

Dick Converse

dconverse@vcog.org

Binghamton

NY

140

2009

1,034

 $ 116

1 WD

Trip

8.98

3.72

John Sterbentz

jsterbentz@co.broome.ny.us

Beaumont Area

TX

137

1993

2,500

 $ 100


Shaun Davis

sdavis@setrpc.org

Pueblo Area

CO

128

1993

1,000

 $ 100


Bill Moore

bmoore@peublo.us

Yakima Area

WA

117

2003

1,107

 $ 136


J. Page Scott

scottp@yvcog.org

Boulder Area

CO

108

2006

1,200


1 WD

Trip

5.50

5.70

Chris Hagelin

hagelin@boulder.colorado.gov

Boulder Area

CO

108

2000

1,241


1 WD

Trip

5.46

6.10

Chris Hagelin

hagelin@boulder.colorado.gov

Boulder Area

CO

108

1990

2,300

 $ 87

1 WD

Trip

5.90

5.90

Chris Hagelin

hagelin@boulder.colorado.gov

Greenville Area

NC

97

1998

1,000

 $ 60

1 WD

Trip


Daryl Vreeland

dvreeland@greenvillenc.gov

Springfield Area

OH

87

2002

1,349

 $ 98

1 WD

Activity

8.03

5.00

Greg Giaimo

greg.giaimo@dot.state.oh.us

Altoona Area

PA

80

2006

1,024

 $ 122

1 WD

Trip

9.09

2.41

John Ciprich

jciprich@state.pa.us

Steubenville Area

OH

80

2002

1,276

 $ 103

1 WD

Activity

6.87

4.46

John Brown

jbrown@bhjmpc.org

Mansfield Area

OH

71

2002

2,101

 $ 63

1 WD

Activity

8.49

5.27

Richard Adair

radair@rcrpc.org

Lima Area

OH

70

2002

2,098

 $ 63

1 WD

Activity

7.71

4.88

Thomas Mazur

tmazur@lacrpc.com

Newark Area

OH

65

1999

1,800

 $ 111


Jerry Brems

jbrems@lcounty.com

Goldsboro Area

NC

63

2003

675

 $ 141


Trip


Nora McCann

namccann@ncdot.gov

Pikes Peak Area

CO

35

2002

1,816


1 WD

Trip

7.70

3.00

Robert MacDonald

go to website to email www.ppacg.org

Pikes Peak Area

CO

35

1992

1,600

 $ 94

1 WD

Trip


Robert MacDonald

go to website to email www.ppacg.org

Statewide and Special


Kentucky (4 rural counties)

KY

420

2001

1,000

 $ 165

1 WD

Trip


Lynn Soporowski

lynn.soporowski@ky.gov

UC Davis Campus (web based)

CA

45

2009

4,133


1 WD

Trip


Kristen Lovejoy

'kelovejoy@ucdavis.edu'

UC Davis Campus (web based)

CA

45

2002

1,024

 $ 30

1 WD

Trip


4.00

Kristen Lovejoy

'kelovejoy@ucdavis.edu'

58 Counties around CA

CA

25000

2001

17,040

 $ 113

1 WD

Trip

10.32

4.38

Diana Portillo

dianaportilla@dot.ca.gov

Texas

TX

23904

2001

3,500

 $ 165

2 WD

Trip


David Pearson

David-pearson@tamu.edu

New York

NY

19298

2001

13,423

 $ 134

1 WD

Trip

8.81

3.91

Jorge Argote

jargote@dot.state.ny.us

Ohio

OH

11467

2002

2,500

 $ 105

1 WD

Activity

7.92

4.94

Amy Prater

prateam@ci.akron.oh.us

Michigan

MI

10072

2004

14,996

 $ 140

2 WD

Trip

8.71

2.47


New Jersey

NJ

8686

1987

3,700

 $ 38


James DeRose


Wisconsin

WI

5602

2001

1,600

 $ 165


Ruben Anthony Jr

sec.exec@dot.stae.wi.us

Maryland 

MD

5618

1991


Ron Spalding

rspalding@mdot.state.md.us

Maryland 

MD

5618

1966


Ron Spalding

rspalding@mdot.state.md.us

Hawaii (less Oahu Island)

HI

550

2001

1,500

 $ 165


Brennon Morika


Oregon

OR

3747

2008

19,000


Becky Knudson

rebecca.a.knudson@odot.state.or.us

Oregon

OR

3747

2005

1,828


Becky Knudson

rebecca.a.knudson@odot.state.or.us

Oregon (8 rural counties)

OR

1200

1996

3,200

 $ 114

2 WD

Activity

7.70


Becky Knudson

rebecca.a.knudson@odot.state.or.us

Sydney, AUS

X-AUS


2004

3,500


Tim Raimond

Tim.Raimond@transport.nsw.gov.au

London Area, UK

X-UK


2002

6,815


O. Christpherson

Olivia.christophersen@dft.gsi.gov.uk

Toronto Area, Canada

X-CAN


2006


1 WD

Trip

7.08

2.64

Gerry Steuart

steuart@ipint.utoronto.ca

Toronto Area, Canada

X-CAN


2001

30,000


1 WD

Trip

7.20

2.67

Gerry Steuart

steuart@ipint.utoronto.ca

Toronto Area, Canada

X-CAN


1996

30,000


1 WD

Trip

6.96

2.57

Gerry Steuart

steuart@ipint.utoronto.ca

Average


1999


8.94

3.88


REFERENCES

A.J. Richardson, Elizabeth Ampt and Arnim Meyburg. Survey Methods for Transport Planning, Eucalyptus Press, Melbourne, 1995.

Center for Transportation Studies, University of Minnesota, Metropolitan travel survey archive, http://www.surveyarchive.org/

Cambridge Systematics Inc., Travel Survey Manual,

Kay Axhausen, Current Trends in Travel Demand Data Gathering, 1995.

Peter R. Stopher et. al., Standardized Procedures for Personal Travel Surveys, Report 571,

Peter R. Stopher and H. Metcalf, Methods for Household Travel Surveys, NCHRP Synthesis 236, TRB, 1996. Available at http://www.trb.org/.

Transportation Research Board, Travel Survey Committee website for the manual, http://trbtsm.wiki.zoho.com/., 2009.

Travel Model Improvement Program (TMIP), Scan of Recent Travel Surveys, Travel Model Improvement Program, Report DOT-T-97-08, U.S. Department of Transportation and U.S. Environmental Protection Agency, Washington, DC.

U.S. Department of Transportation, Federal Highway Administration, Urban Origin-Destination Surveys, Washington, D.C., 1973 (reprinted 1975).


  Stopher and Metcalf (1996) estimated survey costs at about $ 7.4 million annually in the US, based on an average cost of $ 400,000 per survey and assuming that ½ of regions conducted surveys per decade.

National Cooperative Highway
Research Program, TRB, 2008. Available at http://www.trb.org/

Federal Highway
Administration, June 1996. Available at: http://ntl.bts.gov/lib/4000/4500/4529/1392.pdf  (main document), and http://ntl.bts.gov/lib/4000/4500/4530/1392a.pdf  (appendices).

    Post a comment

    Your Name or E-mail ID (mandatory)


    Note: Your comment will be published after approval of the owner.


     RSS of this page


     DISCLAIMER
     The opinions and conclusions expressed or implied are those of the authors and are not necessarily those of the Transportation Research Board or its sponsors.