CHAPTER 26.0 USING SMARTPHONES FOR TRAVEL BEHAVIOR STUDIES
Note: Elaine Murakami, FHWA and Stacey Bricka, Texas Transportation Institute were the main authors of this chapter, completed in June 2012. Many other contributed to this chapter including Sandra Rodriquez, NuStats; Kevin Hathaway, Chris Hoffman, and Stephen Lawe, RSG; Caitlin Cottrill, MIT; Roy Whitmore and Paul Kizakevich, RTI.
26.1 INTRODUCTION
This chapter presents details regarding the application of GPS-enabled Smartphone technology to document travel behavior, summarize implementation issues, and identify research priorities to better guide the incorporation of this technology into travel surveys. While Chapter 23 (http://www.travelsurveymanual.org/Chapter-23.html) discusses the application of GPS technology to travel behavior studies and briefly mentions Smartphones with GPS, that chapter focuses much more on using stand-alone GPS data loggers.
Cellphone adoption in the United States lags behind many other countries but Smartphone adoption has been extremely rapid. In February 2012, the Pew Internet Project found that nearly half of American adults – 46% – own Smartphones, compared to 35% in May 2011. 88% of US adults have a cell phone1. GPS has become the standard approach to meeting the E911 requirements for locating people with a cellphone under emergency conditions. In addition to incorporating GPS, most Smartphones also consist of accelerometers, cameras, keyboards and other features which might be useful when writing an app for conducting a travel behavior survey. Many Smartphone apps take advantage of positioning (GPS or WiFi) information, including basic web searching such as Bing with “search nearby” or Yelp.
Smartphones offer the ability to collect both positioning data and questionnaire information, and transmit data in real-time, or near real-time. The use of GPS-enabled mobile phones to gather travel survey data was first attempted in Japan over a decade ago2. Smartphones owned by respondents can eliminate many GPS survey implementation problems including:
Eliminating the need to mail out and retrieve GPS equipment from respondents. The cost of mailing and retrieving GPS equipment is more than just the postage, but includes the labor of packaging, data downloading, telephone reminders for returning the equipment. These costs can be substantial, and when equipment is not returned in a timely fashion, the equipment is not available to be sent to the next round of respondents. Using equipment that is owned by the respondents themselves means that they are already familiar with the equipment, they are used to re-charging the battery, and they do not have to package the equipment for return. All of these contribute to lowering respondent burden.
Reducing the time between the data collection and respondent review of their travel. When using a GPS data logger, the respondent cannot perform a “prompted recall” web-based survey until the GPS data logger has been returned, and the data downloaded from the unit and uploaded onto a web survey. If the data is collected in “near real-time”, the respondent can review their data at the end of that day or perhaps the next day.
Reducing costs for replacement of GPS equipment loss. In a recent study conducted in Cincinnati, Ohio, the project sustained a loss of 68 percent of GPS units3. However, the next GPS survey conducted by the same firm used a small cash incentive provided to respondents after the successful return of the GPS equipment and sustained only a minor loss of equipment4.
26.2 IMPLEMENTATION ISSUES
The following are implementation issues identified based on recent tests and pilot projects.
26.2.1 Varying Smartphone Platforms
In the U.S., over 50 percent of Smartphones are running Android, with smaller shares for iOS, RIM, and several other OS. Because of the rapidly fluctuating market, for which OS the app is written will dictate ability of potential respondents to participate.
26.2.2 Survey Period
In Smartphone surveys, the time required to input information about one or two trips can be minor at each point in time, respondents seem to be willing to participate over multiple days, compared to the traditional one or two day traditional travel diary. The concept of survey response burden, when divided into multiple short incidents throughout the day seems to be less burdensome than a 15 or 20 minute telephone interview, to report all trips. In addition, because the respondent controls when and where they input their information is another reason that the survey is perceived to be less burdensome.
26.2.3 Passive or Active Data Collection
The typical Smartphone user seems to keep GPS on continuously and does not bother to turn it off and on, depending on the application they are using. Many apps use location to offer customers discounts, e.g., FourSquare and Check-In. Other apps such as Bing, Yelp and Urban Spoon also offer users the opportunity to select “nearby” businesses. In Seattle, “One Bus Away” is one of the most popular apps, developed by PhD students at the University of Washington. This location-based app provides real time bus information, where the user selects the location of their bus stop, and then can select from the routes that service that location.
A passive data collection system would function similar to current GPS data loggers, where an app would be installed on a Smartphone and then capture and transmit location information over a specified time period. The app could monitor location and accelerations and go to “sleep” to conserve battery life. Then, similar to current GPS data loggers, respondents would be asked to review their travel behavior in a prompted recall, after travel mode and trip purpose are imputed.
An active data collection system (see the section on the NuStats PaceLogger) would ask respondents to use their Smartphone to enter information either regularly, e.g. when beginning a new trip, ending a trip, or randomly. Queries for each trip or a random trip, could include questions about trip purpose, travel mode, number of persons accompanying the respondent, how far in advance the trip was planned, parking costs. If the number of questions about each trip is small, e.g. less than 3, and the interface can reduce the time needed to reply to less than 1 minute for each trip, the respondent burden may be perceived as very low. An active system was designed for the first GPS travel behavior study conducted in 1995/96 in Lexington, KY. Questions asked for each trip included: driver identification, passenger identification, and trip purpose. In that project, a Sony MagicLink combined with a Garmin GPS receiver was used to measure only vehicle trips due to battery requirements5.
26.2.4 Incentives
According to research done by TTI, “pioneering travel survey apps have sought to incentivize use and offset potential costs by offering user benefits such as time and location-relevant traffic and transit alerts, trip review capabilities, and draws for prizes. But these apps are generally not designed for constant data collection over extended periods. Given the potential for recruitment challenges and user costs in a smartphone external survey, more significant incentives may be required.” In pilot testing a Smartphone app in the Portland region, NuStats found that a $10 incentive was sufficient, but this may have been a novelty effect. One possible and very relevant incentive may be to offer to cover cellphone/data plan for 1 month. Another method for continuing to involve participants in a Smartphone based study could be to use SMS/text messages as a reminder.
26.2.5 Battery Life
Battery life continues to drive much of the design of portable computers combined with GPS. Much progress has been made from the first GPS travel survey equipment for all travel modes including bicycling and walking that was deployed in a 1997 study in the Netherlands which weighed over 4 lb (2 Kg)6. A viable travel survey app should work on the public’s Smartphones and be capable of gathering required data without disabling a device’s calling, texting or browsing functions or rapidly depleting its battery. Respondents are used to charging their Smartphones on a regular basis. In the diabetes research project reported by Doherty and Oh, an extended 2600mAh battery was added to the Smartphone, and the internal GPS was disabled and replaced with a self-powered external GPS that communicated via Bluetooth. In the Quantified Traveler project (see below), location (route) was imputed by relying more heavily on WiFi (80%) for most locations in order to reduce battery consumption. Individual project goals would determine the best method for capturing location, as GPS data would be necessary if travel speeds or acceleration data are needed, not just route.
26.2.6 Data Storage
Another potential technology concern is data storage. Interactive tracking apps that store trip data on the device before uploading to a server may exhaust the device’s available memory. The impact of this issue is particularly relevant to older Smartphones and those that offer limited database support. An app that regularly sends data to the cloud may be a better design.
26.3 TRAVEL BEHAVIOR SURVEYS WITH GPS
In this section, examples of travel behavior surveys incorporating a Smartphone application are presented.
Example #1: UC Berkeley Quantified Traveler
Contact: Raja Sengupta email: Sengupta@ce.berkeley.edu
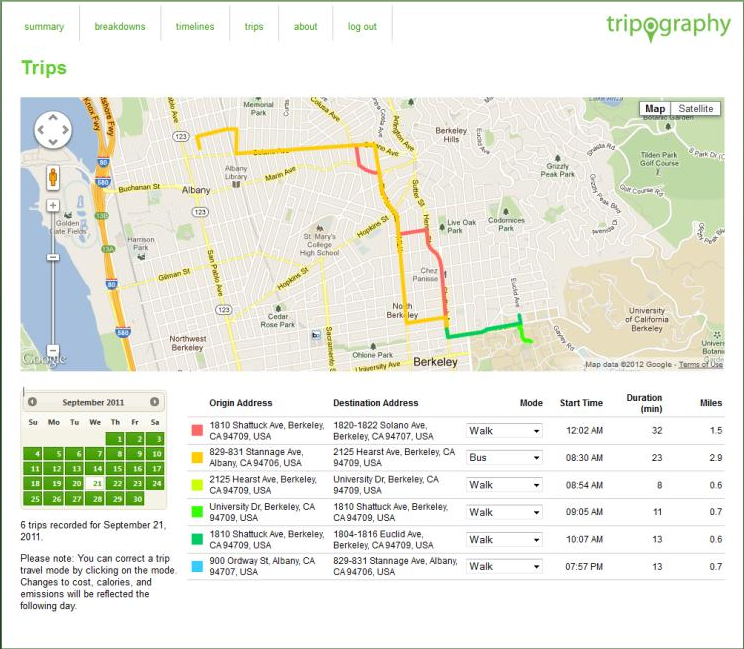
The “Quantifiable Traveler” app was developed by UC Berkeley. This application was recently piloted with about 80 people tracking their travel for a survey period of more than two weeks. The Smartphone app acts as a passive data collector, relying on WIFI (80%) and GPS (20%) for imputing a travel route (see Figure 26.1). Through a combination of both using predominantly WIFI instead of GPS and minimizing the amount of data collected, the battery life was extended.
One trade-off that is often discussed in relation to passive location tracking is how much detail about travel speed and route is needed to impute route and mode. In this app, there was an average of 30 location points per hour. Using prompted recall, respondents were asked to review their travel and to make modifications as needed to the imputed route and travel mode. For vehicle drivers, 94% of trip routes were verified as correct, but for BART trips, over 50 percent of routes were corrected by respondents. About 14 percent of imputed modes were changed to another travel mode during the respondent verification stage.
 Fig 26.1: Imputing route from limited GPS and WiFi points
Fig 26.2: Summary of imputed travel modes and locations shown to participants
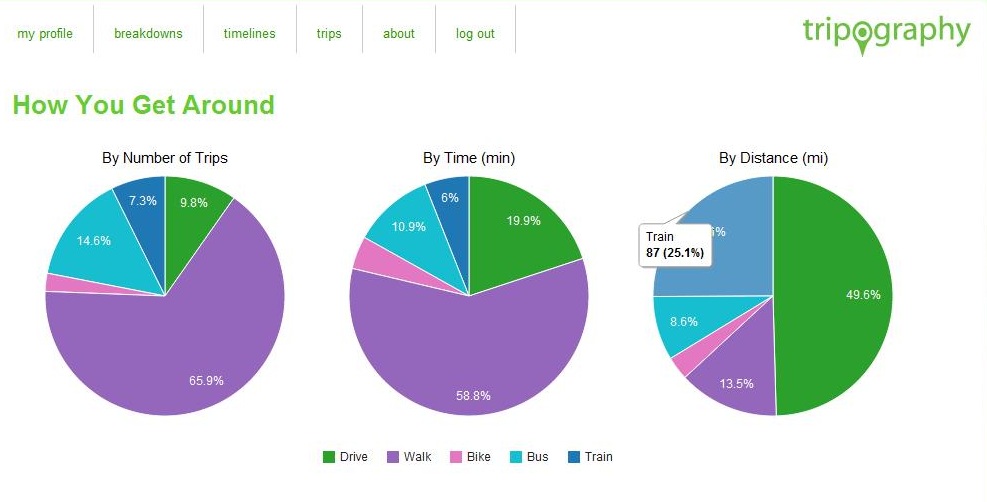
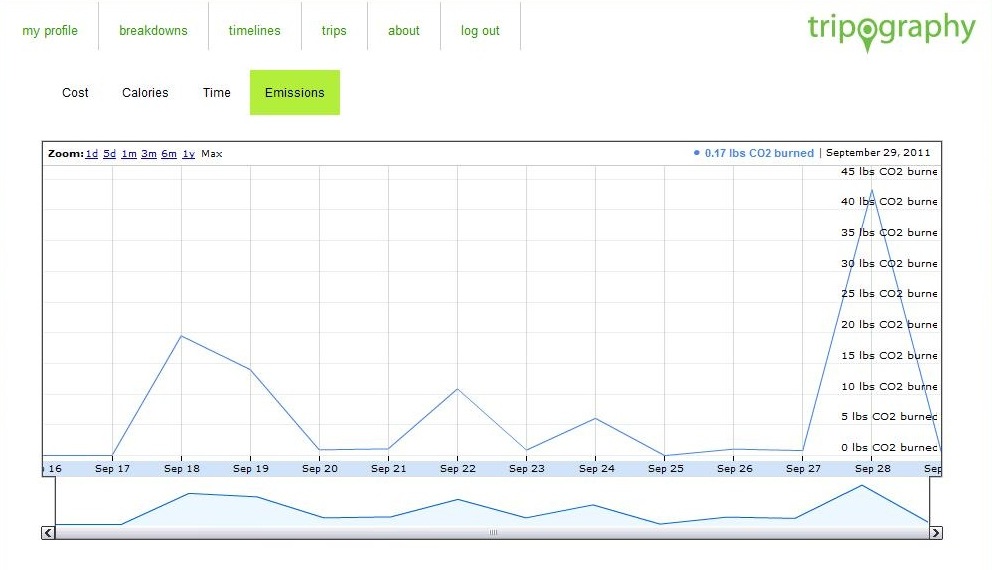
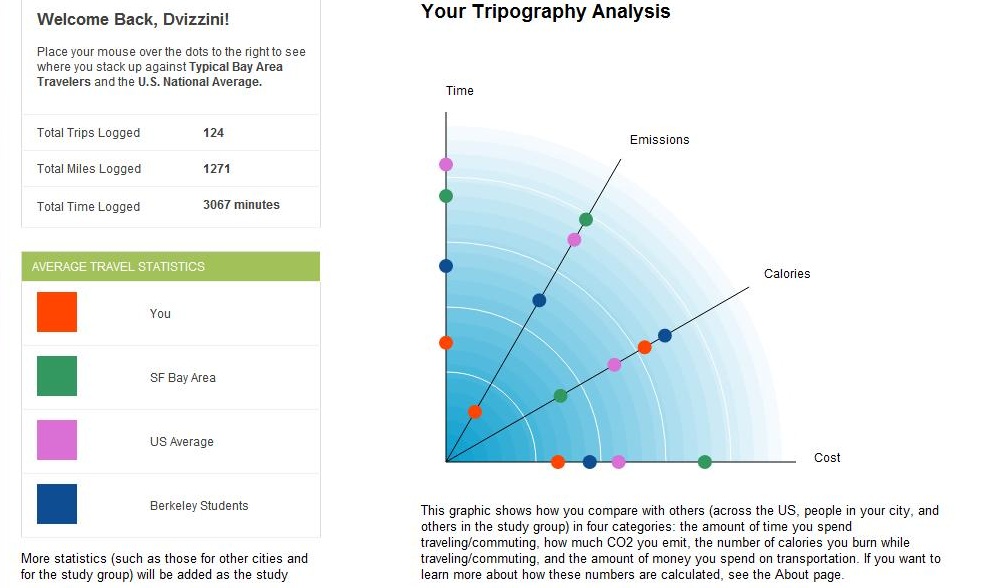
This app is designed to provide feedback to respondents about calories burned, greenhouse gas emissions, travel time and travel cost (Figure 26.3) In conversation, the researchers conveyed that one respondent complained that his daily VMT should not always be given a “poor” score because he could not change his work location which was more than 25 miles away. Because of this, the feedback screen was revised to show reduction targets in percentage terms7.
Fig 26.3: Three Feedback screens provided to participants about their travel
Example #2: NuStats PaceLogger
Contact: William McDonald, Phone: (512) 306-9065, Email: wmcdonald@nustats.com
As part of NuStats role as prime contractor conducting the Oregon Travel and Activity Study (OTAS), NuStats worked in close collaboration with Portland METRO staff to develop a Smartphone application for deployment alongside the Portland, OR portion of the statewide household travel study. The PaceLogger application was developed as a demonstration as a specific proof-of-concept—notably, that 1) recruited household travel study participants would be willing and able to collect GPS data via Smartphone during their travel date and 2) this GPS data could be successfully linked back to travel diaries to provide additional analysis and modeling value.
The ultimate product ( PaceLogger) successfully captured detailed GPS trip data for over 1,000 study participants, demonstrating that Smartphone applications could serve as an inexpensive, easily deployable means of gathering accurate supplemental trip level GPS data for adding value to traditional household travel study trip data.
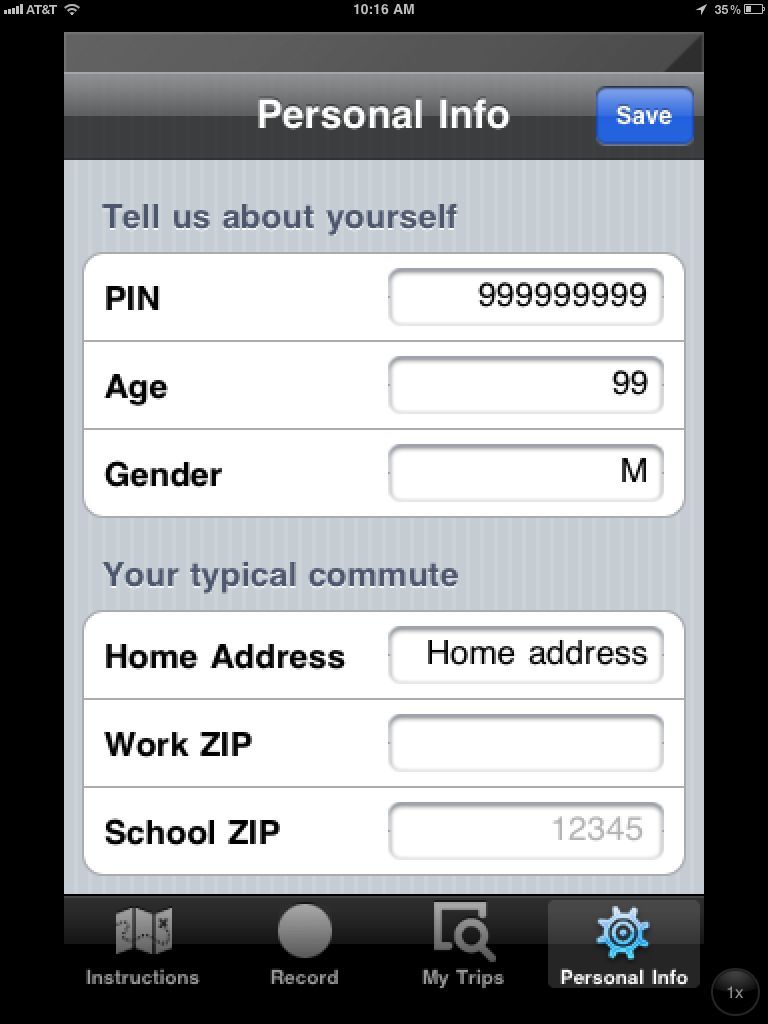
From a development standpoint, NuStats chose to modify an existing open-source licensed smartphone application originally designed to capture cyclist route choices. This application, CycleTracks (see summary below or visit the CycleTracks webpage) was developed by the San Francisco County Transportation Authority and is currently being used by several agencies across the country. CycleTracks application provided the ability to leverage Smartphone technology to collect accurate GPS traces on a trip-level basis and upload these GPS records to a NuStats database. NuStats adapted the program by building an interface for capturing traveler information so that the record of GPS traces could be easily tied to participant recruitment and retrieval data. In addition to this respondent data (basic demographics, personalized PIN number), NuStats also added instructional text, FAQ’s, and other features to facilitate program use by participants (Figures 26.4 thru 26.6).
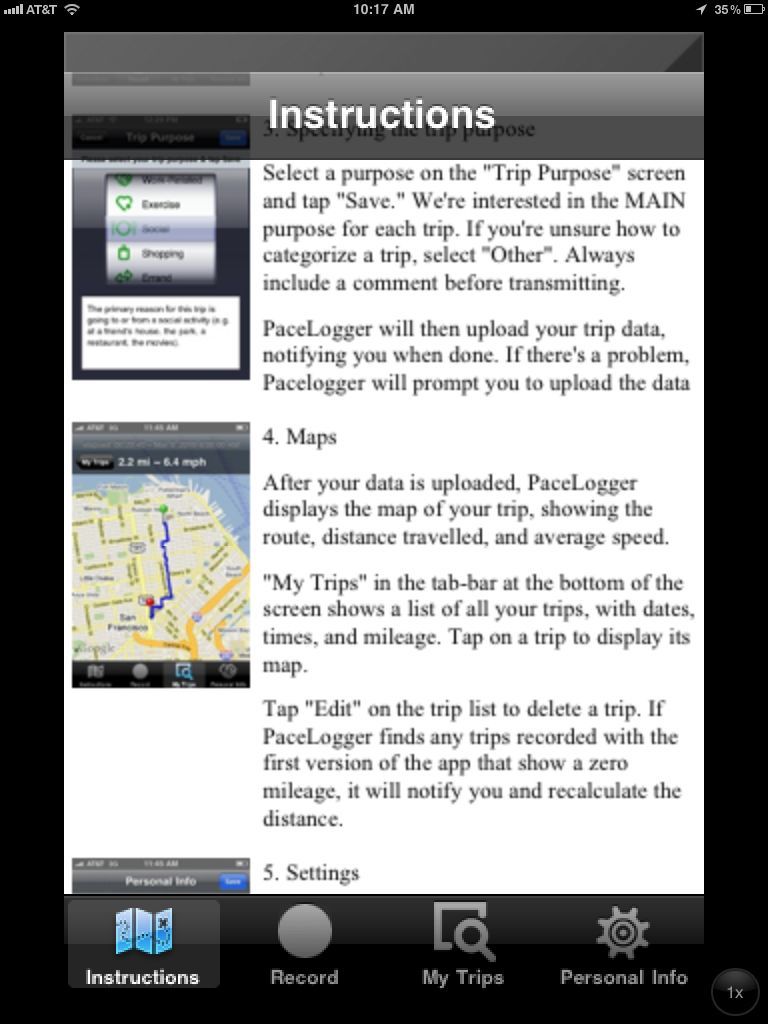 Fig 26.4 Instructions
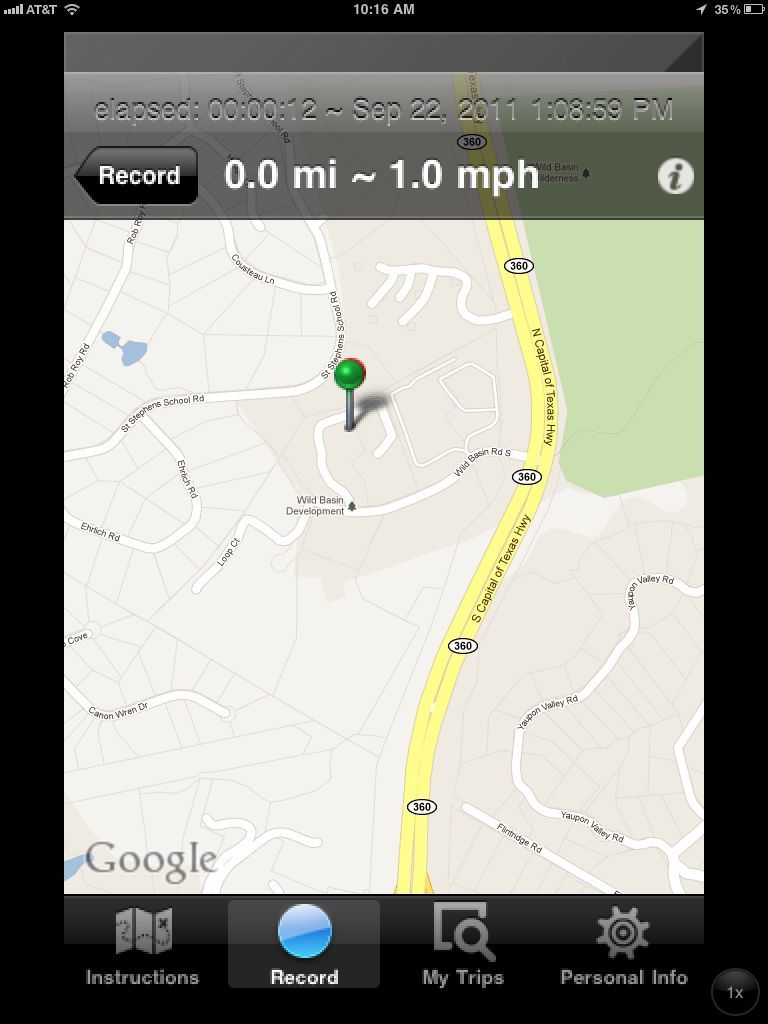 Fig 26.5 Record trips screen
Fig 26.6 Basic demographics screen
Compared to the current practice of providing GPS data loggers to respondents by mail, the use of respondent-owned Smartphones reduces the hardware costs of conducting a household travel survey and there is a significant improvement in the timeliness of travel survey data retrieval, because the data is sent via cellular phone networks, rather than relying on respondents to return equipment.
In this study, the Smartphone survey was limited to only one day, to coincide with the traditional paper diary. The Smartphone app did not request travel mode from the respondent.
PaceLogger proved highly functional and widely used by study participants. No issues were reported with regards to battery drain or other technical problems. The quality of data in general was excellent, with less than 10% of submitted person-level records failing QC checks and removed from delivery dataset—a percentage that is bound to improve with additional experience with the program. While NuStats did provide a $10 per household member incentive for using the PaceLogger application, recruitment staff felt that this incentive was not the primary driver of respondent participation, but rather that curiosity, novelty, and respect for technological efficiency underscored the effort. In fact, the most frequently received feedback on PaceLogger was a wish for the software to replace the traditional diary and retrieval stages of the household travel study. Currently, NuStats is working to improve the functionality of PaceLogger and examining means of expanding the application’s use. In compliance with the GPL open-source license of CycleTracks, PaceLogger's source code is available online .
Example #3: University of South Florida, Center for Urban Transportation Research (CUTR) TRAC-IT
Contact: Sean Barbeau, Phone: (813) 974-3120, Email: barbeau@cutr.usf.edu
http://www.locationaware.usf.edu/ongoing-research/projects/trac-it/
The TRAC-IT project was initially funded by Florida DOT as a value pricing project, not involving vehicle tolls. The Phase 3 project was conducted in 2007, and the final report was completed in 2008. http://www.locationaware.usf.edu/wp-content/uploads/2011/06/TRACIT-Phase-III-final-report.pdf
The project changed Smartphones over time, starting with a Motorola iDen i580 phone, and then a Sanyo SCP-7050 phone. The app was written in Java Micro Edition (Java ME). The user interface includes questions on location description, travel mode, trip purpose and vehicle occupancy.
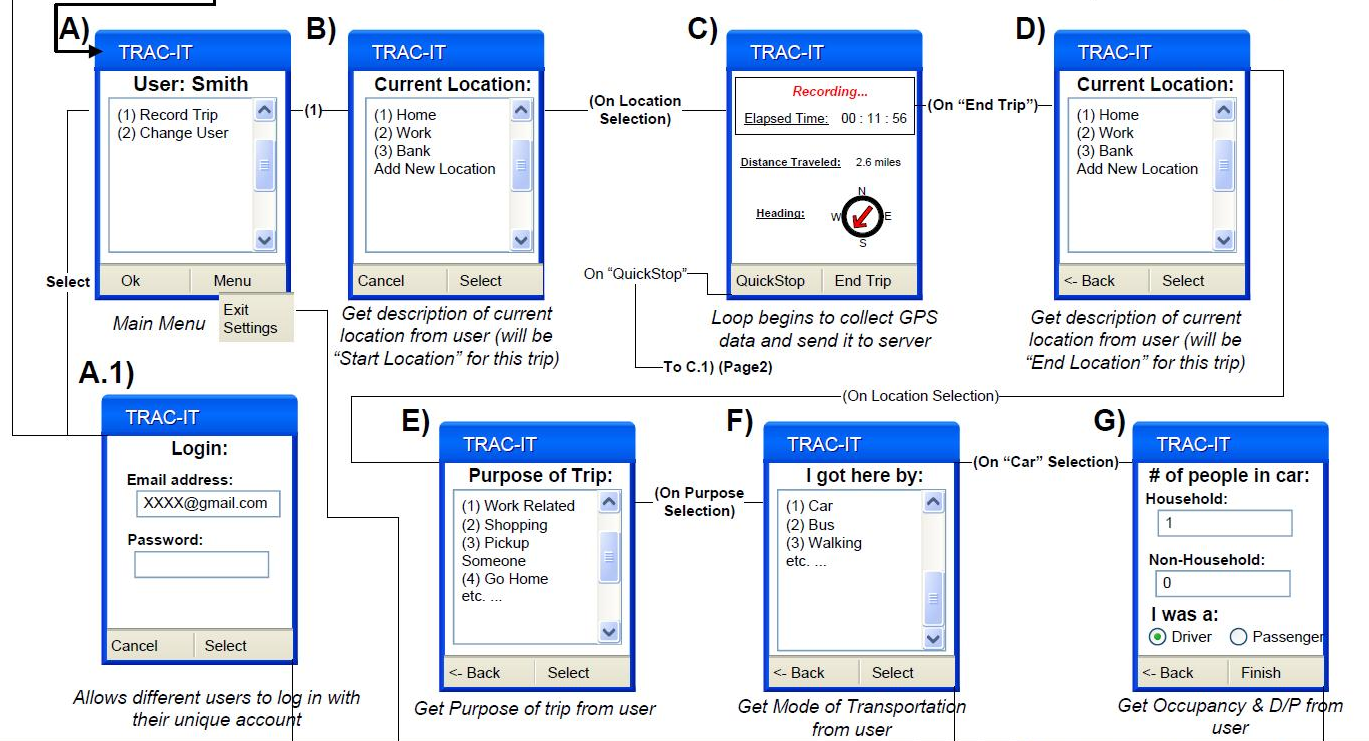 Fig 26.7 TRAC-IT User Interface8
J2ME was used as the programming language, and used the JSR179 Location API.
This project used the Sprint-Nextel iDEN and CDMA cellular networks because they were the only two networks AT THE TIME to expose access to mobile phone location data to third party applications.
The TRAC-IT app was tested using 14 volunteers. Some of the problems identified were remembering to start and stop recording trips. They would remember to take the phone with them, but would forget to start recording their trips. One of the comments a survey volunteer was to ask why the phone did not automatically start and stop the trip recording.
Example #4: Future Mobility Survey, Singapore
Contact: Caitlin Cottrill, Email: cdcottrill@gmail.com
Introduction
The Future Mobility Survey is a novel Singapore-based transport survey that is designed to take advantage of the ubiquity of smartphones and their associated technologies (such as GPS, GSM, WiFi, and accelerometers). The survey will augment and expand the usefulness of traditional household travel surveys by integrating standard questions (regarding household demographics, activities, and travel modes) with a web-based prompted-recall survey that makes use of smartphone location-tracking abilities. It is hypothesized that the use of the smartphone tracking application will: 1) Address issues that have plagued traditional travel surveys, such as missed trips and imprecise trip timing recall, and 2) provide detailed travel data in a format useful and usable for activity-based transportation modeling.
Overview
The survey consists of three parts, namely: 1) A general individual and household demographic overview (completed online); 2) questions that assess well-being and individual attitudes towards transportation and housing options; and, 3) An online prompted-recall activity diary, where users will be asked to report more detailed information about their recorded activities. Approximately 150 people will be recruited to take part in the pilot survey in Spring 2012, each of whom will be asked to install a location tracking application on his or her smartphone, or on a smartphone provided by the project. Each participant will be asked to track his or her location via the application for a period of two weeks, and periodically validate the identified stops and activities. These validated stops and traces will, in turn, be integrated with on-going transport modeling activities, and will be used to provide inputs into long-term modeling activities.
Concerns and Solutions
Three primary concerns have influenced the design of the planned interface and intelligence; namely,
- Resource use,
- Adequacy of data, and
- User burden.
The first concern, resource use, is related to the need to be parsimonious with respect to battery usage in order to forestall participation reluctance due to “dead phone” concerns. Addressing this issue has taken place in two ways:
- Place constraints on the transmission of data from the smartphone to the server: Location transmission is not continual, but rather occurs only when enough new data have been collected; and
- Select localization technology according to a determination of the tradeoff between battery conservation and precision: Here, for example, GPS provides a good deal of location precision but, as noted, will quickly drain the battery; GSM, on the other hand, provides lower precision but is less resource demanding. The survey as developed will work to determine an adequate balance between these factors.
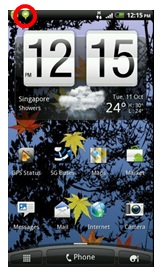
The survey runs as an unobtrusive application in the background of the phone, with only a small icon in the upper-left hand corner indicating that it is running (as shown in Figure 26.8).
Fig 26.8: Application running
The second identified concern, adequacy of data, refers to the need to ensure that the data gathered are adequate for anticipated modelling purposes as well as consistent with previously conducted Singapore household travel surveys (to allow for comparison of data over time). This is closely aligned with the third concern, user burden, as the survey will need to strike a balance between collecting enough data to be useful, while not overwhelming the participant with questions. To address these concerns, much work has been done in the areas of interface and intelligence.
The online interface (as shown in Figure 26.9) has been designed to be simple, intuitive, and attractive to the user. Icons and other visual cues have been used extensively in order to enhance both the intelligibility and attractiveness of the interface, as well as to simplify the user’s interaction. In addition, efforts have been made to limit the amount of interaction that the user will have with the online interface over time via the application of intelligence to gathered data. For this approach, data gathered via the smartphone application are uploaded to a central server, processed, and made available to the user for activity validation. In order to reduce participant burden, the survey is intended to learn from participant history and patterns in movement. For example, mode changes may be detected from patterns in speed and heading change and acceleration, while repeated activities reported by the respondent may be used to pre-fill daily activities prior to activity validation. These efforts will require both accurate data gathering on the part of the Smartphone application, as well as consistent and accurate information entered by the participant.
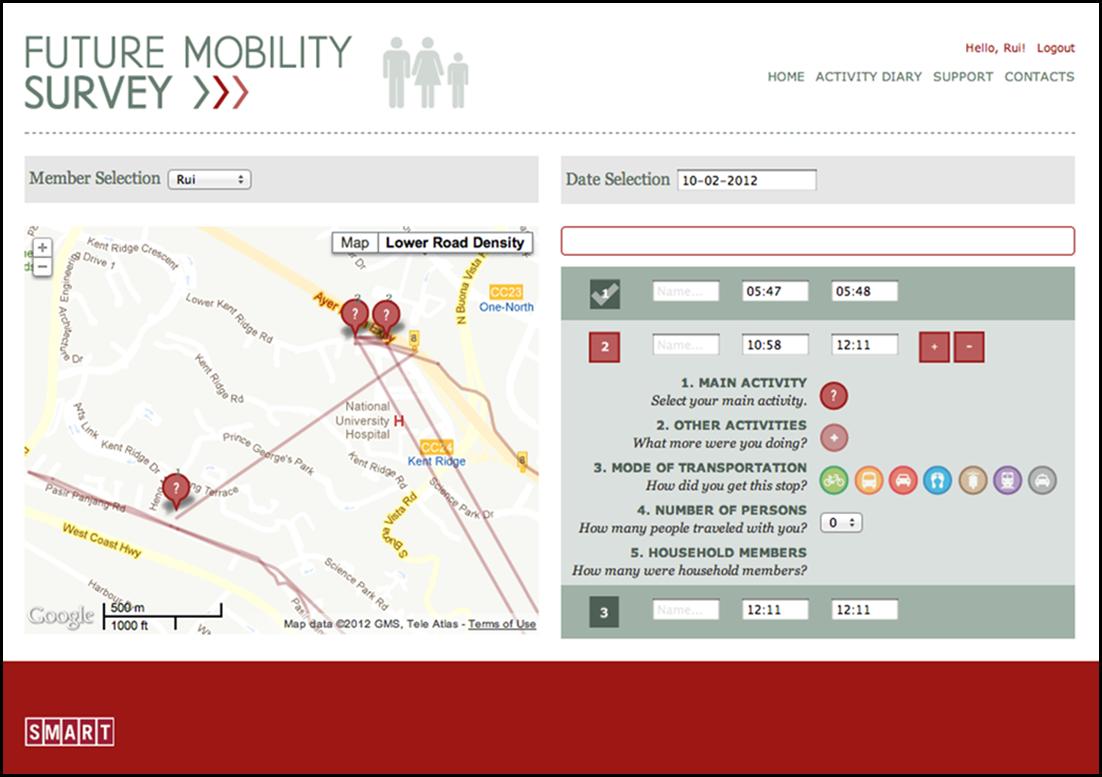 Fig 26.9: Sample survey interface
Next Steps
As of Spring 2012, the survey is in a pre-pilot stage, with internal staff and affiliates running the application to encourage bug-checking, interface improvement, and intelligence development. A full pilot test is scheduled to begin in late Spring of 2012, using social networking avenues (such as email, Facebook and Twitter) to recruit participants and, in turn, asking them to encourage participation from others (a “snowball” approach). It is anticipated that 100-125 participants will be recruited, each of whom will be provided with a SG$30 incentive (roughly the cost of a one-month data plan). Results of the pilot will be used to improve the intelligence and interface, in preparation for an anticipated larger implementation in conjunction with the Singapore Land Transport Authority’s (LTA) 2012 Household Interview Travel Survey (HITS).
APPLICATION OF GPS-ENABLED SMARTPHONE TECHNOLOGY IN RELATED STUDIES
Despite the slower introduction of Smartphone applications to Travel Behavior Surveys, this technology has been widely used in health related studies. Examples are provided here.
Example #5: Diabetes research by Sean Doherty, using BlackBerry +GPS
Sean Doherty, PhD Paul Oh, MD
Wilfred Laurier University Toronto Rehabilitation Institute
sdoherty@wlu.ca oh.pauldr@torontorehab.on.ca
519-884-1970 416-597-3422
Sean Doherty has been at the forefront of integrating BlackBerrys with GPS and activity diaries. In a recent project, a pilot test using wearable sensors wirelessly connected to a BlackBerry 7520 smartphone was used for capturing real-world physiological conditions (e.g. heart rate, acceleration, blood glucose) and daily life (activities, travel, exercise, and food consumption) in persons living with diabetes.
For this pilot test, the sensors include Global Positioning System receiver (GPS), electrocardiogram (ECG), three-axis accelerometer, and continuous blood glucose monitor. A food/medicine diary and prompted recall activity diary were also utilized. The pilot test involved 40 type 2 diabetic patients monitored over a 72 hour period.
Equipment
- Smartphone, with 1600 mAh extended battery and custom software application (BlackBerry 7520: 114 x 75 x 28 mm)
- GPS receiver, connected wirelessly via Bluetooth (GlobalSat BT-338, Sirf Starr III, 72.5mm x 40.4mm x 23 mm)
- Combined Electrocardiogram (ECG) and 3-axis Accelerometer, connected wirelessly to smartphone via Bluetooth (Alive Heart Monitor; 80 x 40 x 15 mm)
- Continuous Glucose Monitoring System (Medtronic CGMS System Gold; 90 x 70 x 22 mm).
- Two diaries were developed for participants:
- Food/medicine diary, paper dairy
- Web-based prompted recall activity diary. (see Figure 26.10 below)
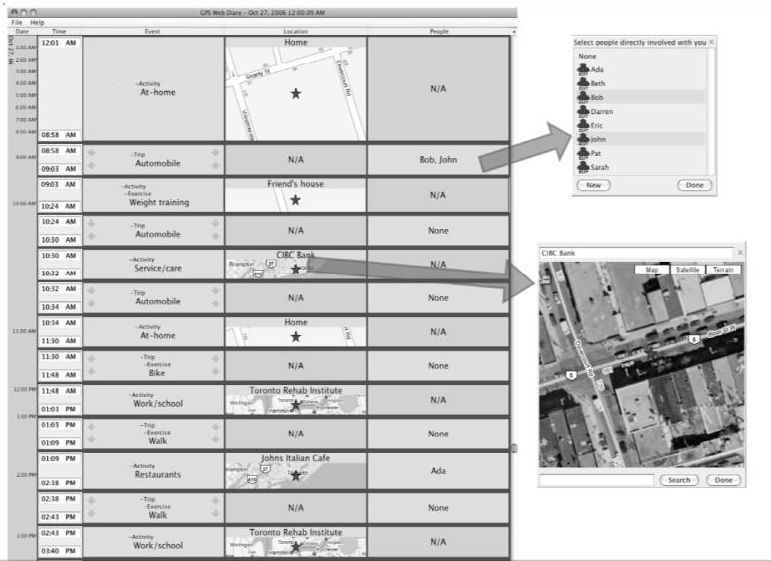 Fig 26.10: Sample of Web-based activity diary
The 40 participants were evenly split by gender, and ranged in age from 32 to 75, and were given incentives valued at $30 CAD. A 72-hour monitoring period was chosen, reflecting the limits of the CGMS.
Results
Overall, 37 of the 40 participants were monitored for the full 72 hour study period. Problems included the tape used to secure the CGMS, GPS data storage problems, battery consumption.
The BlackBerry Smartphone was chose to allow custom data tracking programs to run continuously in the background. A Java software program was developed to control streaming data from the wirelessly connected sensors. The software logged data until it reached a certain threshold (e.g. 50 kilobytes), then compressed it, and transmitted it to a remove server, where it was stored in a MySQL database.
Battery consumption: In order to last a full day, an extended 2600mAh battery was added to the smartphone, and the internal GPS was disabled in favor of an external (Bluetooth) GPS with its own battery.
GPS tracking and activity detection: An average of 20.2 hours (sd 4.6) of GPS data per participant per day was successfully collected. Connection problems to the server and software freezes that were not remedied in the field contributed to some data loss.
A significant challenge that emerged with GPS is the frequency to which location coordinates are unknown owing to signal blockage that occurs under dense cover. Most of these (86.3%) were the result of being indoors. GPS provides a wealth of location traces, but a more challenging task is to develop rules and algorithms to derive observations automatically, such as activity start and end times, travel mode, and activity location.
In summary, Smartphones proved to be an effective hub for managing multiple continuous streams of incoming data under real-world conditions owing to their programmability, on-board data processing, wireless data communication and remobe monitoring capabilities. Off-the-shelf ECG, accelerometer, and blood glucose devices performed adequately, although discomfort contributed to occasional gaps in data. Tracking GPS data for a full data was shown to be very feasible, although significant efforts are needed to impute location coordinate indoors using logical rules and key information from the prompted recall diarly. Automated activity detection algorithms applied to the GPS data successfully indentified stationary activities indoors and outdoors, location names, and trips by mode with up to 95% accuracy.
The proliferation of GPS and accelerometer-enabled Smartphones and the continuing miniaturization of biophysical sensors, raises the possibility of deployment on a larger scale at significantly reduced costs. These developments coincide with changes in the health care industry, including increasing recognition of the role of lifestyle on health, the focus on prevention rather than treatment, prediction rather than response, and disease self-management.
This is an extract of a paper “A multi-sensor monitoring system of human physiology and daily activities” by Sean Doherty, Wilfrid Laurier University and Paul Oh, Toronto Rehabilitation Institute, from Telemedicine and e-Health (in press).
Example #6: Longitudinal Surveys of Human Exposure-Related Behavior by RTI International9
Investigators: Roy Whitmore and Paul Kizakevich
This EPA sponsored project was conducted in 2008/2009 and was designed to capture time, activity, location, exertion and environmental (TALE) and diet and product use data for participants covering 7 days, for use in a longitudinal study to be implemented quarterly. For example, location and time spent traveling would provide a measure of exposure to vehicle emissions.
Phase 1 study involved a multitude of data collection equipment and paper diaries which overwhelmed respondents. The methods included wearable body pack, heart rate sensors, accelerometers, key fobs, digital cameras, and Bluetooth scale in addition to traditional paper diaries. The key lesson learned from Phase 1 was that asking participants to simultaneously keep track of all three types of information – TALE, diet, and product use – was overwhelming. Although each mode had relatively low burden, being responsible for collecting all three types of data negatively affected data completeness and data quality. Although some respondents were intimidated by the PocketPC, others felt that using a paper diary to record their activities and locations was archaic.
In Phase 2, the second-generation data collection platform focused on the Pocket PC given the rapid adoption of Smartphones. The second generation platform was tested in 2 pilot field studies with 16 participants for TALE and 20 participants for dietary data collection. The number of reported (1) activities and locations, (2) foods and drinks, and (3) product use events was used as a proxy for completeness of reporting..
The challenges for the Pocket PC survey mode are primarily technological challenges. With the rapid adoption of Smartphones and comfort level by use in the general public, Phase 2 focused on (1) improving the usability of the Pocket PC diaries and (2) enhancing the passive sensor data collection instruments.
The primary improvements made in the second generation platform include:
- Easy configuration of a field study data collection scheme based on a “protocol” file defining which diaries, sensors, forms, and questionnaires are to be used in a particular study,
- Improved authoring system for data collection menus utilizing database tables,
- Burden-reducing improvements to the TALE, dietary, and product use diaries,
- Enabling three user-selectable means of reporting “other, specify” responses: virtual touch/tap keyboard, voice dictation, and stylus handwriting script,
- Enabling daily review and editing of diary data using a time-sequenced summary of data entries,
- Many improvements to the Body Pack including the addition of an accelerometer for energy expenditure data capture.
In June and July 2008, a 20-person pilot test of the dietary dairy was completed and in March and April 2009, a 16-person pilot test of the integrated TALE dairy and passive data collection instrumentation was completed.
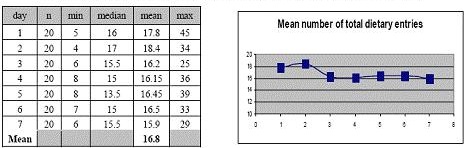
One of the research tests was to examine reporting quality over multiple days. For this, the number of food and activity entries were examined. Although the mean number of total food entries decreased slightly during the 7- day study, the number of daily entries remained remarkably consistent.
Fig 26.11: Number of food and drink entries across all participants by Study Day
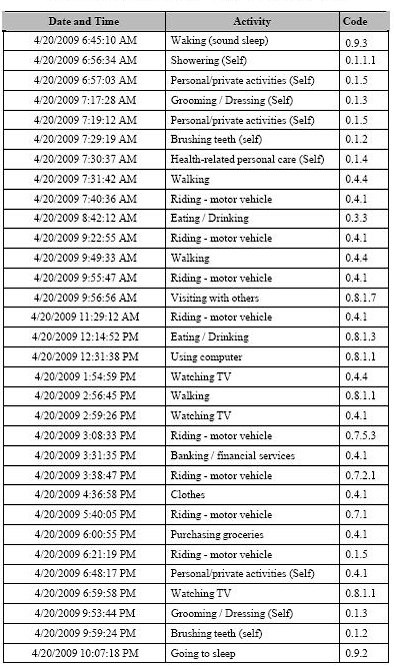
Similarly, location and activity entries were reviewed. Figure 26.12 shows the entries of one person, showing the close association between activities and location.

Fig 26.12: Location data entries for one participant on Day 6
Fig 26.13: Activity data entries for one participant on Day 6
The mean number of data entries per day is presented for each of the TALE diary instruments in Figure 26.14. Data are provided in table and chart formats below.
Fig 26.14: Mean number of TALE data entries per day
Conclusion
The purpose of this project was to develop technologies that could be used to collect accurate, detailed data on human exposure factors for seven consecutive days, at least quarterly, in a longitudinal survey of the general U.S. household population. Users reported that these Pocket PC –based diaries could be used with relative ease, with little burden, and with little intrusion into their daily lives.
At the outset of the project, the research team realized that a clear, easy-to-use interface would be necessary for user acceptance and data entry compliance. After the initial pilot, efforts were made to improve the user interface with a simplified look, a clear font, web-like navigation, and user options such as font-size control. The improved diary productivity (e.g., activity report rate) indicates that these efforts were effective.
For the work on monitoring product-use which relied on fob technology, RTI expects that the fob technology improvements, combined with BlueTooth data transmission, and revisions to the Body Pack will minimize costs to incorporate technological improvements as they come along.
The technologies developed for passive monitoring were fairly successful, especially considering the widely varied aspects of field data collection and changing operational conditions as users went about their day. This project had challenging data collection goals: (1) 24-hour data acquisition for 7 days, (2) low-power, battery-based electronics, (3) wearable sensors and data recording, and (4) variant environments, including homes, vehicles, and various work, commercial, and other locations, and (5) user freedom of movement and locomotion. While we addressed these issues as much as possible in the development of the various systems, use of such technologies under these constraints somewhat limits their effectiveness. Nonetheless, the various sensors and technologies recorded excellent data whenever the conditions were amenable to the technology.
Benefits of using handheld computer diaries included: 1) the data are immediately coded and stored in a secure database, and do not require a data analyst to code responses; 2) the respondent can review his or her data entries and revise the results before submitting which might have better quality. The cost of handheld computers continues to drop. Smartphones offer the additional capability of daily uploading of data to a secure central database, and with integrated GPS receivers and accelerometers have a lower overall cost for diary and sensor data collection. These cost and technology improvements support the economic feasibility of this methodology.
Example #7: Random moments approach with GPS
Nielsen Life360
Justin Bailey and Mike Link, Nielsen
The best example of a random moment survey is the Nielsen Claritas Life 360 started in 2008, with 5 applications in the past 4 years. In one application, respondents were provided with Smartphones and asked to take a photo each hour and to describe their activity. Subsequent designs of Life 360 include a “prompted” survey, where an alarm asks respondents to answer a very brief survey with “in the moment” questions, or ask people to take a photo of where they are now. An alternative approach is the self-initiated approach where respondents are asked to use the phone app when they do a specific activity, e.g. buy a product, eat or drink. Nielsen employed this type of survey to measure brand purchases during the 2010 World Cup and are making plans for a similar application the 2012 Olympics in London10 11. Nielsen’s findings regarding the World Cup survey include:
- “Remarkable and sustained levels of participation” with “very little cross-time degradation.”
- Overall, the survey approached worked well across demographic groups. The biggest differences were seen with the elderly, non-workers and women more likely to report in-home activities as compared to other groups.
- Limitations are that this used a choice sample, and there may be some self-administration bias.
For the 2012 Olympics, the World Cup method will be enhanced with:
- Geofencing – building a virtual wall around areas to track movement
- GPS breadcrumbing – using GPS trails to follow users throughout the day
- Barcode scanning – track purchases
Random Moment Sampling for HUD
Kevin Hathaway, Chris Hoffman, & Stephen Lawe, RSG, Inc.
Jennifer Turnham & Meryl Finkel, Abt Associates, Inc.
Project Background
The Housing Choice Voucher (HCV) program is the federal government’s largest low-income housing assistance program, providing rental assistance to more than 2 million households. The HCV program is administered federally by the U.S. Department of Housing and Urban Development (HUD) and locally by approximately 2,400 local, state, and regional housing agencies, known collectively as public housing agencies (PHAs). PHAs receive funding from HUD to cover the administration of the HCV program.
The purpose of the Housing Choice Voucher Program Administrative Fee Study is to evaluate the amount of funding needed to administer the program based on direct measurement of the work performed and to use that information to develop a new formula for allocating administrative funds across PHAs. HUD has contracted with Abt Associates Inc., RSG, Inc., Quadel Consulting Corporation, and Phineas Consulting, LLC to carry out the study, which will be completed in 2014.
A key component of the study is direct measurement of the work performed by PHA staff to administer the HCV program using Random Moment Sampling. In particular, the study seeks to measure how each PHA employee distributes his/her time among the large set of activities needed to administer the program.
Motivation of Random Moment Sampling Methodology
Random Moment Sampling (RMS) is designed to capture the distribution of activities that a person engages in over some time interval. With appropriate sampling and sufficient data collection, these instantaneous responses provide a large and representative fraction of discrete activity behavior and can prove more accurate than other self-reported activity recording instruments. The responses can then be generalized into time estimates for each discrete activity.
In the early stages of the current HCV Admin Fee study, data collection tests were completed at four public housing authority locations in the United States comparing Random Moment Sampling (RMS) on a Smartphone, a paper timesheet, and direct observation. Participants were randomized to complete two of three time measurement modes. The results of that work demonstrated that RMS was superior to the other two modes in several important ways. During this test, RMS recorded 45 unique activities, while the timesheets only recorded 40 for the same staff in the same week. By way of example, categories “Annual Inspections” and “Drive to Inspections,” which appeared frequently using RMS, were never recorded during the entire week on timesheets. The omission problem manifests itself in time allocation. If Employee X engaged in 11 unique tasks but only records 8, she still records a full day’s work and sprinkles more time across fewer activities. By omitting three tasks, other tasks get too much time. It was an early belief that timesheets would likely capture all activities since every moment of every test day would be described. The contrary result likely can be attributed to one or two common timesheet problems. The first is timesheet fatigue, where people simplify their data entry by aggregating a day’s activities into a smaller set of tasks. The other common problem occurs when employees inadvertently forget all the activities they engaged in that day. Several employees listed this as a challenge for filling in timesheets at the day’s end, indicating it would be easy to omit a few tasks if their day was busy.
Direct observation did not prove useful since costs are exceedingly high having a professional watch and record each employee’s activities over the course of several weeks. Further, the important details around phone calls, computer work, and reports were difficult to describe without continually asking the employee questions. In this regard, direct observation did not prove valuable for this particular time and motion study.
Technology
The RMS instrument was administered with custom-built software on eighty LG™ Vortex 3G touch screen-enabled Smartphones through Verizon Wireless. RSG’s software consisted of two parts: a client and a server. The client was responsible for data collection, while the server was responsible for data storage, monitoring, and reporting. The client for this application was written for Android™ version 2.2.2, using the Android™ SDK provided by Google™ . The Eclipse™ IDE, along with the Google Android™ plug-in, was used for building and packaging the software for deployment to the LG™ Vortex devices. The client software installation was initially conducted via USB uplink, but a HTTP endpoint was available, and made use of, for software updates in field.
To collect the recorded moments from Android devices in real time, data must be relayed to a central server. The server for the RMS software used HTTP, and was written in the Ruby programming language, making use of the Ruby on Rails framework to create a simple, JSON-based API for communicating with the Android clients. MySQL was used as the database back-end. The production environment for the server was a 64-bit Ubuntu 11.10 virtual machine, with an equivalent machine available as a hot spare, serving as a MySQL replication target, to minimize data loss in the event of a catastrophe.
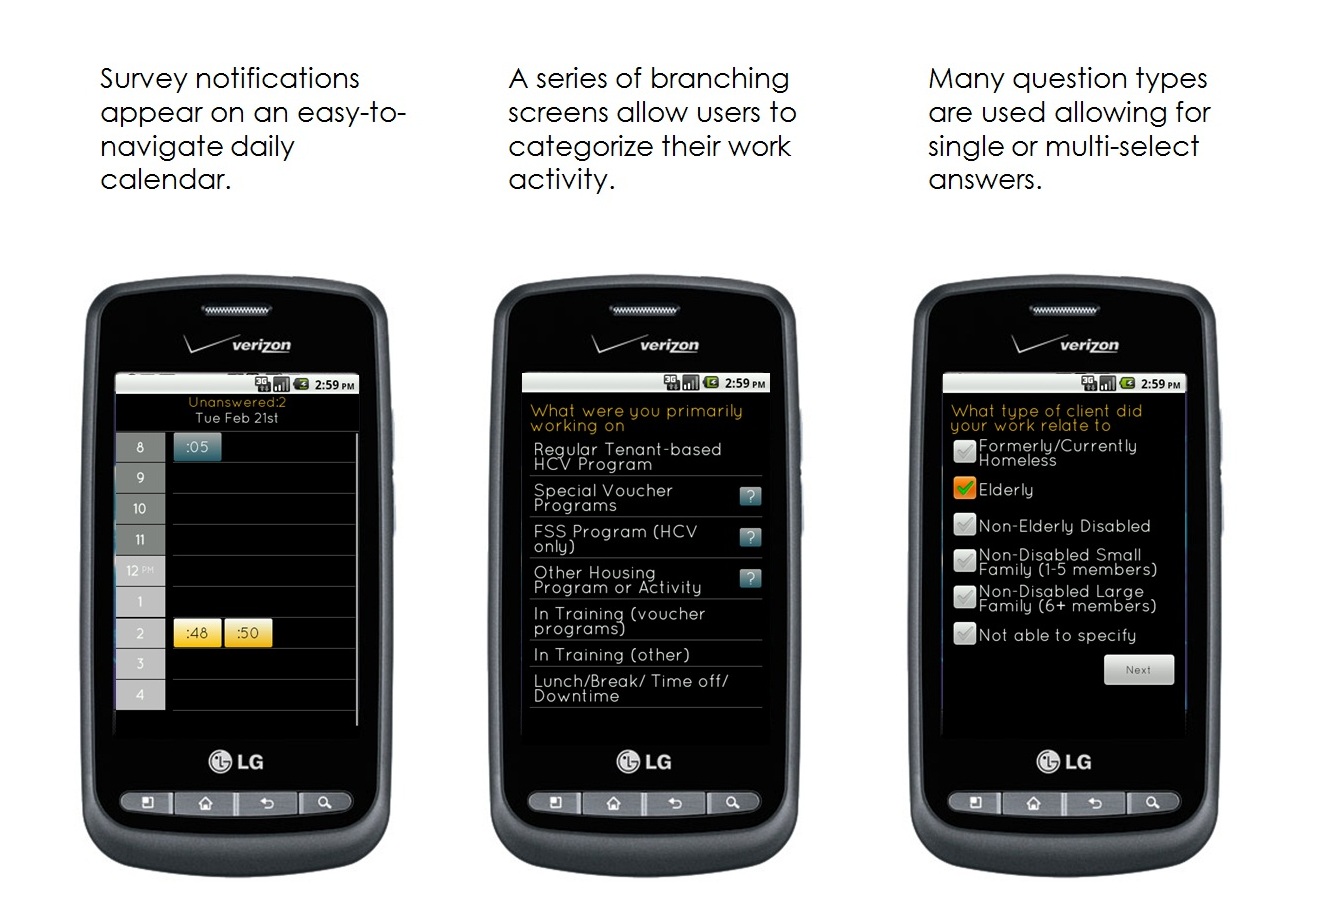 Fig 26.15: Application interface for RMS
RSG staff monitored the data collection through an authenticated website showing the current beta-test site underway, every PHA staff with a device, their collected moments, those not responded to, and notifications still pending. All data were presented in an interactive web dashboard to support the management active field data collection.
Since the research team provided the phones to the participants, additional device controls were needed to lock down the phone’s functionality. These add-on software components prevented the user from using any other feature of the Android device such as surfing the internet, downloading music, or navigating with GPS. Data plans were limited to 50 MB per device per month so minimizing usage to the RMS survey was paramount. Finally, no GPS functionality was used for this particular project since geolocation was not crucial component of data collection. Since the phone only operated the RMS application, battery life was extended beyond typical Smartphone expectations (i.e. participants charged their phones every other day on average).
Implication for Transportation Sector
Transportation planning requires an understanding of how individuals behave which, in turn, requires that these data be collected. However, individuals are notoriously poor at providing accurate information about behavioral choices. Whether born out of privacy concerns or simply an inability to recall the motivation or behavioral details, people have trouble with questions as simple as what types of trips were made during the day and at what time of day and for how long were the trips made. These data collection efforts are most commonly referred to as Household Trip Diary Surveys.
More recently, personal or in-vehicle GPS have been used to refine the accuracy of the data. What they lack, however, are the personal trip details such as trip purpose (eg. Commuting to work) and shared trips (dropping a child at school on the way to work).
Smartphones present one of the first viable options for collecting both GPS data and asking personal trip purpose questions at or around the time of the trip so that memories are still strong. Although Smartphones have had problems with battery life, GPS reliability and data entry challenges they are evolving quickly and are now at least adequate for the purposes of Household Trip Diary Surveys. They also present some very exciting opportunities in further understanding route choice behavior as the detailed route was collected by the GPS unit. The challenge remains the respondent burden required to enter the entire personal trip data needed to make best use of the data.
The random sample data method could be applied to capture travel behavior. With this method, a “profile” of common trip making patterns and anomalous trips within that pattern could be generated. Over the course of days, the survey could focus more on anomalous trips (those trips outside the common pattern such as a 6-month dental appointment). Some advantages might be to reduce respondent burden, increase reliability in responses, add data integrity from the GPS, add value through route choice questions, and increase the survey period).
Example #8: CycleTracks.
The following is excerpted from a Technical Memo written by TTI for TxDOT and from the SFCTA website:
In 2009, the lack of data on bicycle routes preferred by local cyclists led the San Francisco County Transportation Authority (SFCTA) to develop a Smartphone app called CycleTracks. This interactive trip-tracking app was developed to collect data in the San Francisco area for models that would predict what types of routes cyclists were likely to use based on rider characteritics (e.g., level of experience) and characteristics of the bike network (e.g., hills, bike lanes, sharrows). The app can downloaded to iPhone and Android smartphones and was designed to enable easy GPS recording of bicycle routes traversed by cyclists.
Data Collection Approach
The SFCTA chose a Smartphone data collection approach over web-based stated preference surveys, route recall techniques, or personal/bicycle-mounted GPS data loggers based on the following considerations12:
- Low Cost
- High Smartphone market penetration in San Francisco (user base accustomed to downloading apps - increased sampling ability)
- Desire for GPS-native data format with revealed preference as opposed to stated-preference
- Ability to obtain trip purpose
Survey Advertising and Distribution
Regular citizenry were encouraged to participate in the study. Survey advertisement and recruitment was achieved through dissemination of information to local media outlets and social networking groups (Facebook, Twitter, etc) , and e-mail announcements and project links sent to bicycle coalitions and university groups. The free application was distributed online via the iTunes App Store, the Android Market, and SFCTA’s website.
App Design and Function
The main design goals of the app were simplicity and convenience. While there have been many requests for more features, the design team wanted to minimize the influence of the app itself on route choice. Download and installation was quick and the app require a minimum number of taps/clicks to operate. The interface is slightly different between the iPhone and Android platforms, but generally involved the same steps. Before beginning a bike trip, the user opens the app, selects the appropriate trip purpose and clicks start to initiate GPS recording. At the destination, the user reopens the app and clicks finish/save. Upon saving the trip, the data are uploaded to an Amazon EC/2-hosted SFCTA web server using the phone’s data plan. A bicycle bell noise and vibration alert occurs after an initial 15 minutes of GPS data collection (and every five minutes thereafter) to remind users that the app was still running. In addition to uploading trip data, users are provided with the opportunity to enter personal information such as age, gender, frequency of cycling, home and work zip codes, and an e-mail address. The possibility of measuring sample bias through the collection of income data was not pursued due to privacy concerns. Figure 26.16 shows screenshots of the CycleTracks app for the iPhone.

Fig 26.16: Screenshots of the CycleTracks App (iPhone version)13
Technical Considerations
An Apache webserver and “Javascript over network” (JSON) data transfer protocol is used to upload CycleTracks data to a MySQL database in Amazon Cloud. The process of uploading trips to the database took only a few seconds. Tracks that could not be uploaded on the first attempt were marked with an exclamation point and were automatically uploaded the next time a trip was recorded.
The app was made available for use on the Apple iPhone 3G, 3Gs, and 4 and Android GPS-enabled smartphones, and due to popular demand and the collaborative work of other public agencies, an iOS5 version of CycleTracks with background GPS capabilities is currently being tested. The Android version of CycleTracks recorded GPS data in the background, allowing participants to use their phone for other purposes. The iPhone did not offer background GPS recording capabilities at the time of the initial app development. Instead, the app locked the screen during recording to prevent inadvertent trip saving or cancelling. New iPhones have now matched Android in feature parity, so background operation is being developed in an upcoming version. A small proportion of app users/reviewers on the iTunes and Android Market websites reported problems getting the app to install, start up or function properly14 15.
User Incentives
For CycleTracks to be successful as a data collection tool, the study team realized that it had to be valuable or fun for cyclists to use. To this end, uploaded trips were saved to a user’s personalized trip list (along with basic statistics such as distance, time, and average speed) and trip traces could be viewed in a Google Maps format. As a further incentive, users that included an e-mail address and uploaded at least one trip were entered into a drawing for one of several $50 iTunes gift cards. Bike lock stickers were distributed to bicycle coalitions in the CycleTracks study to remind participants to start and stop the app before and after each trip.
Other Agencies using CycleTracks
Since the SFCTA declared the initial San Francisco project a success in 2010, a number of other agencies and municipalities have begun using CycleTracks to understand the needs of cyclists.
Both the application (iPhone and Android versions) and the bike route choice model are open source and available on
Github, to fork and rebrand. SFCTA has also made the (anonymized) data collected via the CycleTracks available too their public agencies who wish to publicize the original application without reworking it, which allows agencies and researchers across the country to replicate and build on what they've done.
In 2011, the Texas Transportation Institute used CycleTracks software in Austin, Texas for a project which completed in August, 201217 and the Association of Monterey Bay Area Governments began using CycleTracks in 2011 to collect bike route choice data in the Monterey area18. Other cities currently using CycleTracks include Raleigh, NC, Fort Collins, CO, Minneapolis/St. Paul, MN, and Seattle, WA. Information about how to get access to CycleTracks data in your area can be found on the SFCTA website. App Development and Source Code
CycleTracks was partially funded through a State Planning and Research Grant from the California Department of Transportation16. A small portion of these funds were directed to the development of the iOS app, which was outsourced to a private firm, Mopimp Productions. The Android version of CycleTracks was developed by Billy Charlton, then an employee at SFCTA. The source code for both the iPhone and Android versions of the app is open source and free for other agencies to use or modify for their respective needs so long as they comply with the GPL license that it is under. The Bryan/College Station MPO has developed a multi-modal travel survey app call AggieTrack that was based on CycleTracks and was designed to collect travel data on Texas A&M student travel patterns19. The CycleTracks code and many other permutations that have been developed for other regions are all maintained under source control on GitHub and available to download and examine interactively online. Other areas that have adapted the code for their own purpose include Lane County Oregon (LaneTracks), Charlottesville, VA, and Atlanta, GA. PaceLogger,which is not mode-specific, is another derivative product of CycleTracks.
Data Quality
The SFCTA reported that the data obtained from CycleTracks were generally good. The two most prevalent issues affecting the capture of complete, clean GPS traces were signal acquisition delay and the ‘urban canyon’ effect. Delays in acquiring the satellite signals needed for accurate positioning data caused an imprecise or “noisy” start to many recorded trips. This was not a problem if the participant allowed the phone enough time (usually about 1 minute) to lock onto satellites before beginning their ride.
The urban canyon effect typically occurred in downtown San Francisco where satellite signals were blocked or reflected by high-rise buildings. Both of these temporary conditions are commonly encountered in GPS data collection and neither would preclude the use of Smartphones in an external travel survey. It should be noted that lack of cellular coverage in an area did not necessarily result in the loss of GPS data or trip deletion20. The app is capable of storing GPS data on the device and transferring it to the server once a network connection is reestablished, making a constant cellular connection not a requirement. Furthermore, most trips that suffered from urban canyon effect leanings were able to be corrected using smoothing techniques and map matching algorithms.
Privacy and Recruitment Issues
A somewhat surprising finding was that although the research team went to great lengths to ensure that personally-identifiable information was not collected, privacy concerns reportedly never came up when discussing the app with actual users. The lack of participant fixation on privacy issues was attributed to their general comfort level with connectedness in society. However, the market penetration of Smartphones and apps in San Francisco (and attitudes there toward the sharing of GPS tracking data) may not be transferrable to other areas of the country.
The initial CycleTracks outreach effort had several pointed criticisms that circled around having a biased sample. The SFCTA responded to these issues in two ways: (1) a cross examination of smartphone users from the Pew Center revealed that the smartphones user population is actually less biased than the typical NHTS sample and actually drew in hard-to-reach populations such as cell-phone only households; (2) the SFCTA is careful to use the data in a way that is appropriate, as an input to an estimation for a model...not to draw lines on maps based on data. There are still assumptions built in to this use - i.e. that the low-income male confident cyclist likes bike lanes equal to the high-income male confident cyclist - but they are fairly minor.
Battery Use
The GPS positioning data collected in CycleTracks were logged at one-second intervals. Beta testing showed that a Smartphone’s battery life could be greatly reduced by the app and that minimizing battery usage during recording was going to be critical. Battery-saving features programmed into the app included dimming of the screen’s backlight during operation and auto app-turnoff if the charge fell below 10% (to preserve enough power for making calls). Notwithstanding these efficiencies, Smartphone battery challenges encountered in the recording of bike trips may be compounded in an external travel survey characterized by lengthy vehicle trips.
One means of addressing this challenge may be to encourage the use of in-vehicle chargers during motorized travel. Another countermeasure could be to lengthen the interval between each recorded GPS point from 1 second to 5 seconds or more to reduce the amount of data collected and power consumed. Because trip start and end locations would be defined by the user in an interactive travel survey, the loss of some resolution in the trip trace may not materially affect data quality (although detection of missed trip ends would become more difficult). An austere app interface may marginally improve battery performance, but research suggests that high-quality, professionally designed applications are an important motivating factor for participation in smartphone surveys21. Consequently, this power-saving strategy may not be worth pursuing. The willingness of smartphone owners to use in-vehicle chargers or potentially run down their battery in order to take part in an external travel survey is unknown and may depend on the level of incentives offered.
Participant Safety
Participant safety issues did not arise in the CycleTracks data collection effort as the app is intended for use before and after trips, and there is no interactivity during the trip itself.
26.4 SUMMARY AND CONCLUSIONS
It is an exciting time to work in travel survey methods, because the opportunities for incorporating Smartphones and developing apps for easy-to-use respondent interfaces and high quality activity and travel behavior data is a new direction. For now (2012), any use of Smartphones as a survey method must be augmented with other methods, because Smartphones are used by about 50 percent of adults in the U.S., and because it is unreasonable to expect a developer to write an app to work for all Smartphone OS, an app will address only a portion of the Smartphone population. There is clearly an age-bias in the Smartphone population. This means that for some respondents, a GPS data logger may continue to be the best approach, and for others, a paper diary or web-based diary with or without a map interface (e.g. Google Maps), may be the preferred approach.
Respondents expect survey researchers to change with the times! As evidenced by the exposure research conducted by RTI for EPA, paper diaries are considered archaic and passé. While it continues to be a struggle to get survey participation today, using methods that reduce burden and show the relevance of the data being collected to each respondent are features that we need to keep at the forefront in the design of our survey implementation.
One advantage of using respondent-owned Smartphones is the ability to collect GPS data for longer periods of time. Multiday data collection using respondent-owned equipment has several advantages including:
- The respondent is already familiar with re-charging their phone
- Variability of travel can be captured, which is important if people shift their behavior to increase trip chaining on a single day, rather than running independent trips on different days (to reduce VMT), or to use non-motorized travel to reduce GHG emissions but only one or two days per week.
- A typical “activity space” prism can be more accurately be defined with multiple travel days.
- Weekend travel can be captured, instead of focusing solely on weekday travel.
People are wedded to their Smartphones and are panic-stricken when they lose their phone, as it has become a “life line” to keep in contact with friends and family, and to continually research new destinations, bargains, sports scores, etc. Because people are so tied to their phones, and the monthly bill may range from $30 to $60, incentives to participate in the travel behavior survey in exchange for the price of their monthly bill may be an important incentive for recruiting participants.
Research ideas:
- Testing the random moments approach for creating activity/travel behavior inventory.
- Comparing a GPS data logger to a random moments survey.
- Testing different incentives when conducting a Smartphone travel and activity survey.
NOTES
- Pew Internet and American Life Project http://pewinternet.org/Reports/2012/Smartphone-Update-2012/Findings.aspx
- Hato, E., and Y. Asakura. New Approach for Collection of Activity Diary Using Mobile Communication Systems. Paper submitted for presentation to the 80th Annual Meeting of the Transportation Research Board, Washington, D.C., 2001
- GPS-Based Household Interview Survey for the Cincinnati, Ohio Region. (State Job Number PS-09-07) Peter Stopher and Laurie Wargelin. February 2012
- Travel Behavior Inventory conducted for the Metropolitan Council of Twin Cities. Telephone conversation with Jonathan Erlich, May 2012. And L Wargelin (AbtSRBI) presentation at the Household Travel Survey Subcommittee meeting at the TRB Annual Meeting, Washington DC, January 2012
- Battelle final report to FHWA. “Lexington Area Travel Data Collection Test” September 1997. http://www.fhwa.dot.gov/ohim/lextrav.pdf
- Draijer, G., N. Kalfs, & J. Perdok. (2000). Global positioning system as data collection method for travel research, Transportation Research record, 1719, 147-153
- Conversation with J. Jariyasunant, TRB Annual Meeting, January 2012
- Smart Phone Application to Influence Travel Behavior (TRAC-IT Phase 3) NCTR, CUTR at University of South Florida, March 2008 http://www.nctr.usf.edu/pdf/77709.pdf
- http://cfpub.epa.gov/ncer_abstracts/index.cfm/fuseaction/display.abstractDetail/abstract/7434/report/F
- Jennie W. Lai, L. Vanno, M. W. Link, J. Pearson, H. Makowska, K. Benezra, and M. Green. “Life 360: Usability of Mobile Devices for Time Use Surveys.” Paper presented at American Association for Public Opinion Research, Hollywood, FL May 2009
- J. Bailey. “Nielsen Life 360 Approach” presentation at Consumer Expenditure Survey June 2011 Household Survey Producers Workshop http://www.bls.gov/cex/geminimaterials.htm
- Charlton, B., E. Sall, M. Schwartz, and J. Hood. Bicycle Route Choice Data Collection Using GPS Enabled Smartphones. Paper presented to the 90th Annual Meeting of the Transportation Research Board, Washington, D.C. Available at http://www.sfcta.org/images/stories/IT/CycleTracks/bikeroutechoicedatacollection.pdf
- Charlton, B., E. Sall, M. Schwartz, and J. Hood. Bicycle Route Choice Data Collection Using GPS Enabled Smartphones. Paper presented to the 90th Annual Meeting of the Transportation Research Board, Washington, D.C. Available at http://www.sfcta.org/images/stories/IT/CycleTracks/bikeroutechoicedatacollection.pdf
- iTunes CycleTracks Reviews. http://itunes.apple.com/us/app/cycletracks/id338203326?mt=8
- Android Market CycleTracks Reviews. https://market.android.com/details?id=org.sfcta.cycletracks&feature=search_result
- Ojah, M. et al. The Use of GPS Technology in Household, Transit, and Bicyclist/Pedestrian Surveys. Technical Memorandum prepared for the Maricopa Association of Governments, April 2011
- CycleTracks Austin. http://cycletracksaustin.com/
- Sall, Elizabeth., San Francisco County Transportation Authority, Personal Communication, September 6, 2011
- Bryan/College Station Metropolitan Planning Organization. http://www.aggietrack.com/
- Sall, Elizabeth., San Francisco County Transportation Authority, Personal Communication, October 2, 2011
- Itsubo, S. and E. Hato. A Study of the Effectiveness of a Household Travel Survey using GPS- equipped Cell Phones and a Web Diary Through a Comparative Study with a Paper-Based Travel Survey. Paper submitted for presentation to the 85th Annual Meeting of the Transportation Research Board, Washington, D.C., 2006
 Uploading ....